. 2011 Jan;105(1):305-20.
doi: 10.1152/jn.00795.2010. Epub 2010 Nov 10.

Organization of the macaque extrastriate visual cortex re-examined using the principle of spatial continuity of function

Affiliations

Organization of the macaque extrastriate visual cortex re-examined using the principle of spatial continuity of function

T N Aflalo et al. J Neurophysiol. 2011 Jan.

Abstract

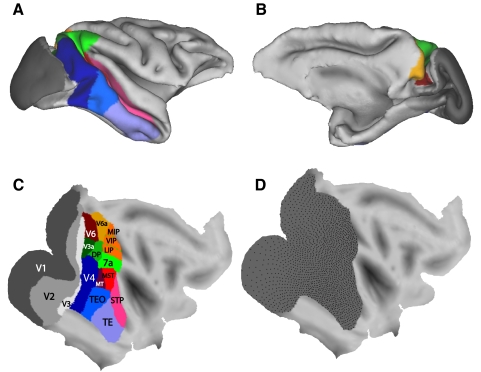
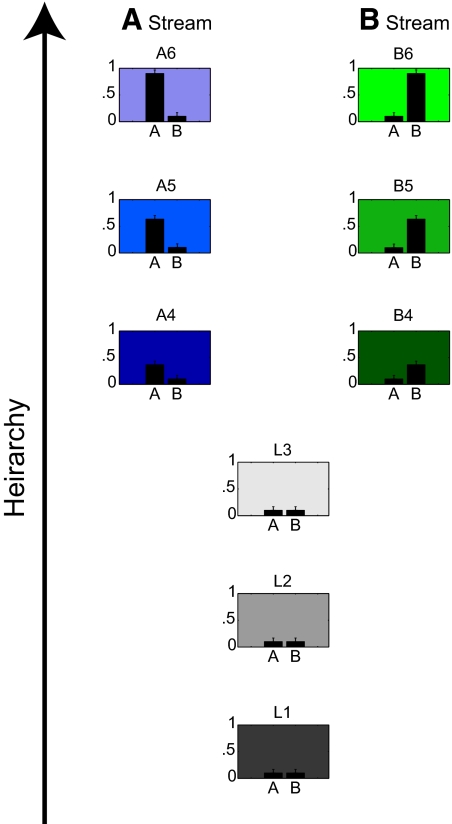
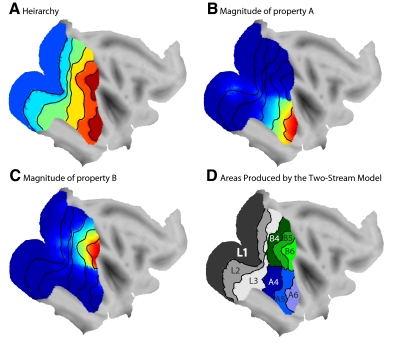
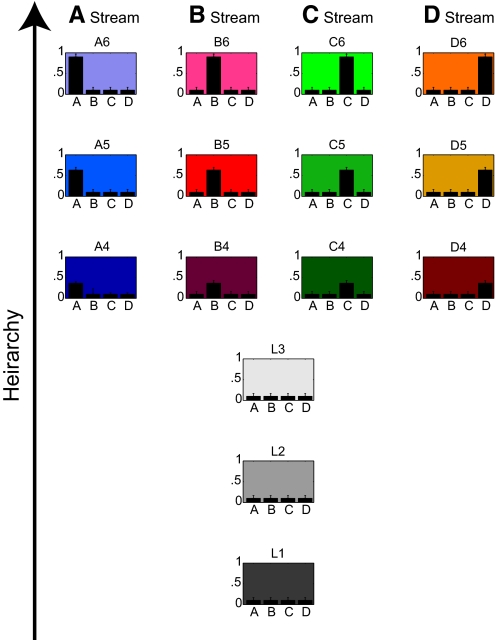
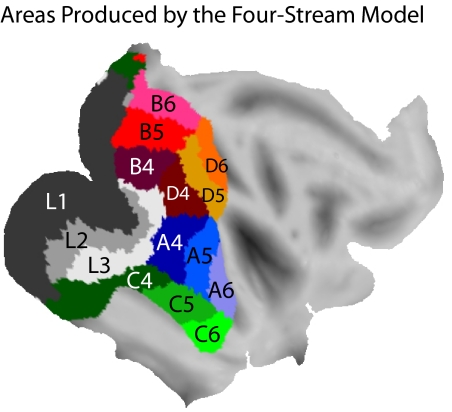
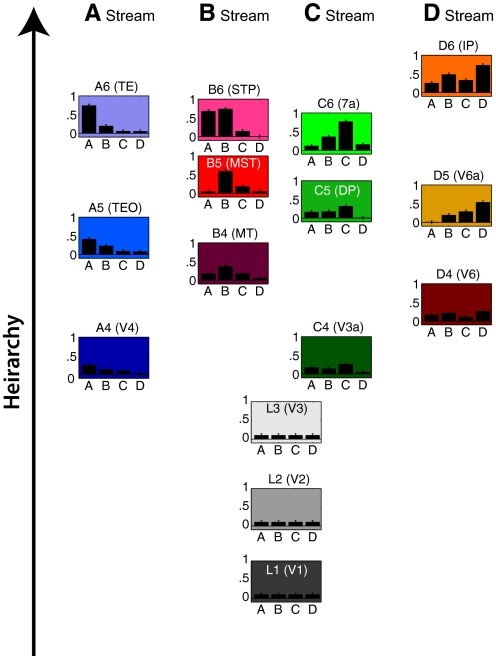
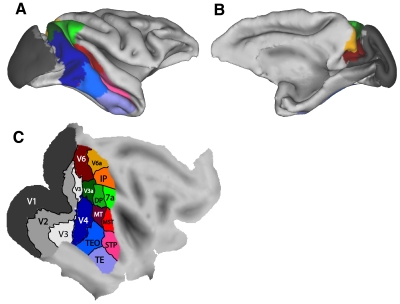
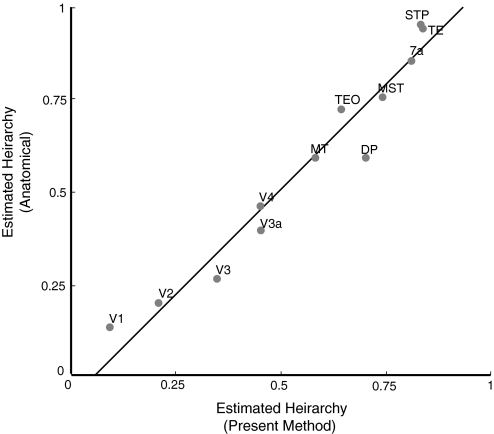
How is the macaque monkey extrastriate cortex organized? Is vision divisible into separate tasks, such as object recognition and spatial processing, each emphasized in a different anatomical stream? If so, how many streams exist? What are the hierarchical relationships among areas? The present study approached the organization of the extrastriate cortex in a novel manner. A principled relationship exists between cortical function and cortical topography. Similar functions tend to be located near each other, within the constraints of mapping a highly dimensional space of functions onto the two-dimensional space of the cortex. We used this principle to re-examine the functional organization of the extrastriate cortex given current knowledge about its topographic organization. The goal of the study was to obtain a model of the functional relationships among the visual areas, including the number of functional streams into which they are grouped, the pattern of informational overlap among the streams, and the hierarchical relationships among areas. To test each functional description, we mapped it to a model cortex according to the principle of optimal continuity and assessed whether it accurately reconstructed a version of the extrastriate topography. Of the models tested, the one that best reconstructed the topography included four functional streams rather than two, six levels of hierarchy per stream, and a specific pattern of informational overlap among streams and areas. A specific mixture of functions was predicted for each visual area. This description matched findings in the physiological literature, and provided predictions of functional relationships that have yet to be tested physiologically.


Figures

Fig. 1.
Fig. 1.
The macaque visual cortex. A: a lateral view of the folded cortex based on the anatomical images and Caret software of Van Essen and colleagues (2001). The surface is taken from the depth half-way through the cortical thickness. Some of the main visual areas are displayed in color and labeled. B: a medial view of the same cortical model as in A. C: a flattened version of the same model shown in A and B. D: the down-sampled set of 1,892 nodes, distributed across the visual cortex, used in the functional mapping algorithm.
Fig. 2.
Fig. 2.
The data set used for the 2-stream model. Each of the 9 data clusters is represented by a graph. The vertical position of the graph indicates the mean hierarchy value on a scale of 0 to 1. The 2 bars in the graph indicate the mean values of properties A and B on a scale of 0 to 1. The error bars indicate the SD (0.05) of the 2,500 points that comprised each data cluster. Numerical values are provided in Table 1. The 3 data clusters at the lowest hierarchical levels are labeled L1–L3. The higher hierarchical levels of the A stream are labeled A4–A6. The higher hierarchical levels of the B stream are labeled B4–B6.
Fig. 3.
Fig. 3.
The topographic results of arranging the 2-stream model onto the cortical surface. A: the hierarchy values were mapped across the cortical surface, forming bands of different hierarchical levels. Hot colors represent higher hierarchy values. B: the value of property A mapped across the cortical surface. Hot colors represent higher values. The black lines show the divisions between hierarchical levels. C: the value of property B mapped across the cortical surface. Hot colors represent higher values. The black lines show the divisions between hierarchical levels. D: functional areas distinguishable on the basis of the properties mapped in A–C.
Fig. 4.
Fig. 4.
The data set used for the 4-stream model. Each of the 15 data clusters is represented by a graph. The vertical position of the graph indicates the mean hierarchy value on a scale of 0–1. The 4 bars in the graph indicate the mean values of properties A–D on a scale of 0–1. The error bars indicate the SD (0.05) of the 2,500 points that comprised each data cluster. Numerical values are provided in Table 2. The 3 lowest hierarchical levels are labeled L1–L3. The higher hierarchical levels of the A stream are labeled A4–A6. Similar labeling indicates the data clusters within the B–D streams.
Fig. 5.
Fig. 5.
The topographic results of arranging the 4-stream model onto the cortical surface. The areas are colored according to the same code as in Fig. 4.
Fig. 6.
Fig. 6.
The data set used for the optimized 4-stream model. Each of the 15 data clusters is represented by a graph. The vertical position of the graph indicates the mean hierarchy value on a scale of 0–1. The 4 bars in the graph indicate the mean values of properties A–D on a scale of 0–1. The error bars indicate the SD (0.05) of the points that comprised each data cluster. (The error bars do not indicate the reliability of the solution obtained by optimization. Instead they indicate the dispersion of each of the data clusters that comprise the optimized solution.) Numerical values are provided in Table 3. The particular values of hierarchy and properties A–D were adjusted for all visual areas by a genetic fitting algorithm until the information structure, when rendered onto the cortical sheet, produced a close match to the correct cortical topography. The 3 lowest hierarchical levels are labeled L1–L3. The higher hierarchical levels of the A stream are labeled A4–A6. Similar labeling indicates the data clusters within the B–D streams. The acronym in parenthesis indicates the known visual area that matches best in cortical location.
Fig. 7.
Fig. 7.
The topographic results of arranging the optimized 4-stream model on the cortical surface. The functional areas are labeled based on their topographic similarity to real areas in the macaque monkey brain. The optimized 4-stream model was able to reconstruct the organization of the macaque extrastriate visual cortex with great accuracy.
Fig. 8.
Fig. 8.
Hierarchical ranking of visual areas. x axis represents relative hierarchical ranking based on the data set in Fig. 6. y only axis represents relative hierarchical ranking as determined by a previous study (Hilgetag et al. 2000) based on anatomical connectivity. Visual areas were equated between studies as follows: MST (from present study) = MSTd + MSTl (from Hilgetag et al. 2000). TEO = VOT + PITv + PITd. TE = CITv + CITd + AITv. STP = STPa + STPp. Dorsal areas V6, V6A, and IP were not included in the plot for 2 related reasons. First, it was not clear how to match these areas between the present study and Hilgetag et al. (2000). Second, the areal boundaries and connectivity of these dorsal areas (Galletti et al. 2005) were detailed mainly after the publication of Hilgetag et al. (2000).

Similar articles

Cited by

References

    1. Aflalo TN, Graziano MSA. Possible origins of the complex topographic organization of motor cortex: reduction of a multidimensional space onto a 2-dimensional array. J Neurosci 26: 6288–6297, 2006 - PMC - PubMed
    1. Albright TD, Desimone R, Gross CG. Columnar organization of directionally selective cells in visual area MT of the macaque. J Neurophysiol 51: 16–31, 1984 - PubMed
    1. Andersen RA, Bracewell RM, Barash S, Gnadt JW, Fogassi L. Eye position effects on visual, memory, and saccade-related activity in areas LIP and 7a of macaque. J Neurosci 10: 1176–1196, 1990 - PMC - PubMed
    1. Andersen RA, Essick GK, Siegel RM. Encoding of spatial location by posterior parietal neurons. Science 230: 456–458, 1985 - PubMed
    1. Anderson KC, Siegel RM. Three-dimensional structure-from-motion selectivity in the anterior superior temporal polysensory area, STPa, of the behaving monkey. Cereb Cortex 15: 1299–1307, 2005 - PMC - PubMed

Publication types