

doi: 10.1523/JNEUROSCI.3330-10.2010.
Assessing neuronal metabolism in vivo by modeling imaging measures
Affiliations
- PMID: 21068308
- PMCID: PMC3044872
- DOI: 10.1523/JNEUROSCI.3330-10.2010
Item in Clipboard
Assessing neuronal metabolism in vivo by modeling imaging measures
J Neurosci.
.
Abstract
Mitochondrial dysfunction contributes to the pathogenesis of many neurological diseases, including multiple sclerosis (MS), but is not directly measurable in vivo. We modeled N-acetyl-aspartate (NAA), which reflects axonal structural integrity and mitochondrial metabolism, with imaging measures of axonal structural integrity (axial diffusivity and cord cross-sectional area) to extract its mitochondrial metabolic contribution. Lower residual variance in NAA, reflecting reduced mitochondrial metabolism, was associated with greater clinical disability in MS, independent of structural damage.
Figures

Imaging neuronal metabolism in vivo. a, Sagittal T2 image of a patient 6 months after an acute spinal cord relapse due to the two lesions between C1 and C3 (yellow circles). b, Spectroscopic volume of interest between C1 and C3 on the coronal image. c, Regions of interest located in the white matter columns on the axial diffusivity maps. d, FSPGR image at C2–C3 with the regions of interest contoured around the cord. e, Spectrum obtained by the LCModel analysis of the volume of interest shown in b. The NAA concentration was 3.94 mm /L (percentage SD = 11).
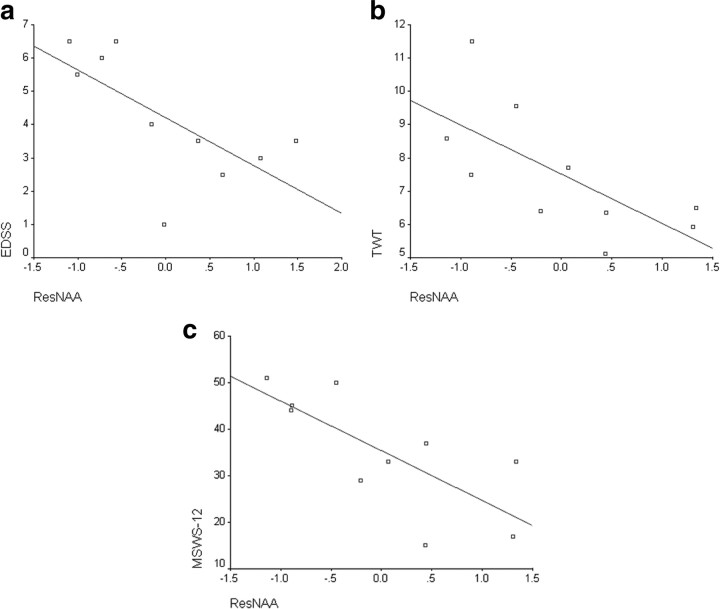
Relationship between the residual variance in NAA concentration after taking into account structural imaging measures and clinical scores. a, Scatter plot of ResNAA versus EDSS (R2 = 0.5) with a fitted line. b, Scatter plot of ResNAA versus TWT (R2 = 0.42). c, Scatter plot of ResNAA versus MSWS12 (R2 = 0.4).
Similar articles
-
Axonal damage in the spinal cord of multiple sclerosis patients detected by magnetic resonance spectroscopy.Magn Reson Med. 2007 Nov;58(5):880-5. doi: 10.1002/mrm.21382. Magn Reson Med. 2007. PMID: 17969113
-
Neurological disability correlates with spinal cord axonal loss and reduced N-acetyl aspartate in chronic multiple sclerosis patients.Ann Neurol. 2000 Dec;48(6):893-901. Ann Neurol. 2000. PMID: 11117546
-
Spinal cord repair in MS: does mitochondrial metabolism play a role?Neurology. 2010 Mar 2;74(9):721-7. doi: 10.1212/WNL.0b013e3181d26968. Epub 2010 Jan 27. Neurology. 2010. PMID: 20107138 Free PMC article.
-
The role of mitochondria in axonal degeneration and tissue repair in MS.Mult Scler. 2012 Aug;18(8):1058-67. doi: 10.1177/1352458512452924. Epub 2012 Jun 21. Mult Scler. 2012. PMID: 22723572 Review.
-
Mitochondrial dysfunction and axon degeneration in progressive multiple sclerosis.FEBS Lett. 2018 Apr;592(7):1113-1121. doi: 10.1002/1873-3468.13013. Epub 2018 Mar 25. FEBS Lett. 2018. PMID: 29453889 Review.
Cited by
-
NAA is a Marker of Disability in Secondary-Progressive MS: A Proton MR Spectroscopic Imaging Study.AJNR Am J Neuroradiol. 2020 Dec;41(12):2209-2218. doi: 10.3174/ajnr.A6809. Epub 2020 Nov 5. AJNR Am J Neuroradiol. 2020. PMID: 33154071 Free PMC article. Clinical Trial.
-
Decreased NAA in gray matter is correlated with decreased availability of acetate in white matter in postmortem multiple sclerosis cortex.Neurochem Res. 2013 Nov;38(11):2385-96. doi: 10.1007/s11064-013-1151-8. Neurochem Res. 2013. PMID: 24078261 Free PMC article.
-
Brain core temperature of patients with mild traumatic brain injury as assessed by DWI-thermometry.Neuroradiology. 2014 Oct;56(10):809-15. doi: 10.1007/s00234-014-1384-5. Epub 2014 Jul 12. Neuroradiology. 2014. PMID: 25015424 Free PMC article.
-
Mitochondrial dysfunction is an important cause of neurological deficits in an inflammatory model of multiple sclerosis.Sci Rep. 2016 Sep 14;6:33249. doi: 10.1038/srep33249. Sci Rep. 2016. PMID: 27624721 Free PMC article.
-
Quantifying the Metabolic Signature of Multiple Sclerosis by in vivo Proton Magnetic Resonance Spectroscopy: Current Challenges and Future Outlook in the Translation From Proton Signal to Diagnostic Biomarker.Front Neurol. 2019 Nov 15;10:1173. doi: 10.3389/fneur.2019.01173. eCollection 2019. Front Neurol. 2019. PMID: 31803127 Free PMC article. Review.
References
-
- Bates TE, Strangward M, Keelan J, Davey GP, Munro PM, Clark JB. Inhibition of N-acetylaspartate production: implications for 1H MRS studies in vivo. Neuroreport. 1996;7:1397–1400. - PubMed
-
- Bjartmar C, Kidd G, Mörk S, Rudick R, Trapp BD. Neurological disability correlates with spinal cord axonal loss and reduced N-acetyl aspartate in chronic multiple sclerosis patients. Ann Neurol. 2000;48:893–901. - PubMed
-
- Chang LC, Jones DK, Pierpaoli C. RESTORE: robust estimation of tensors by outlier rejection. Magn Reson Med. 2005;53:1088–1095. - PubMed
-
- Ciccarelli O, Wheeler-Kingshott CA, McLean MA, Cercignani M, Wimpey K, Miller DH, Thompson AJ. Spinal cord spectroscopy and diffusion-based tractography to assess acute disability in multiple sclerosis. Brain. 2007;130:2220–2231. - PubMed
Publication types
MeSH terms
Grants and funding
LinkOut - more resources
Full Text Sources
Medical