. 2010 Nov 10;30(45):15085-96.
doi: 10.1523/JNEUROSCI.0471-10.2010.

Neural correlates of associative face memory in the anterior inferior temporal cortex of monkeys

Affiliations

Neural correlates of associative face memory in the anterior inferior temporal cortex of monkeys

Satoshi Eifuku et al. J Neurosci. .

Abstract

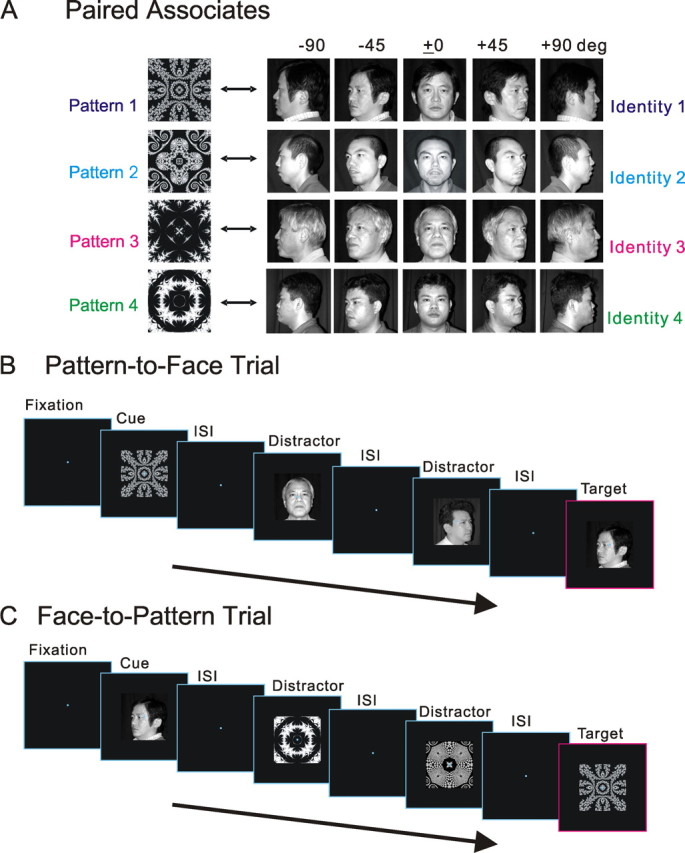
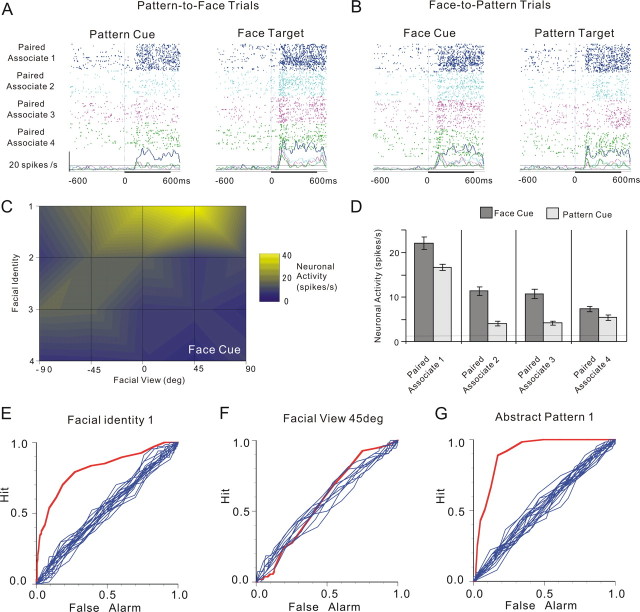
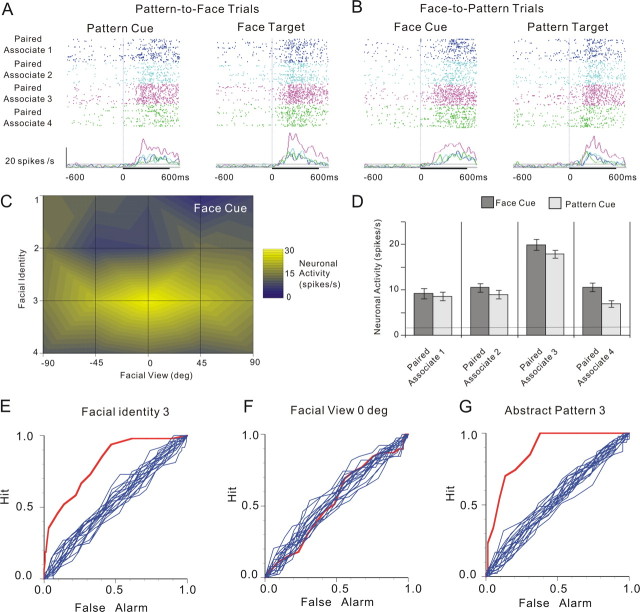
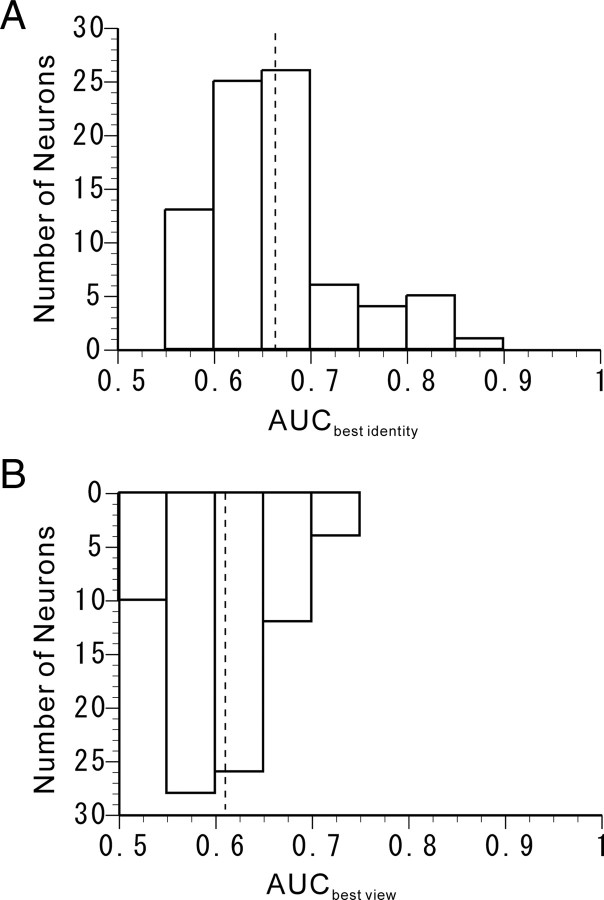
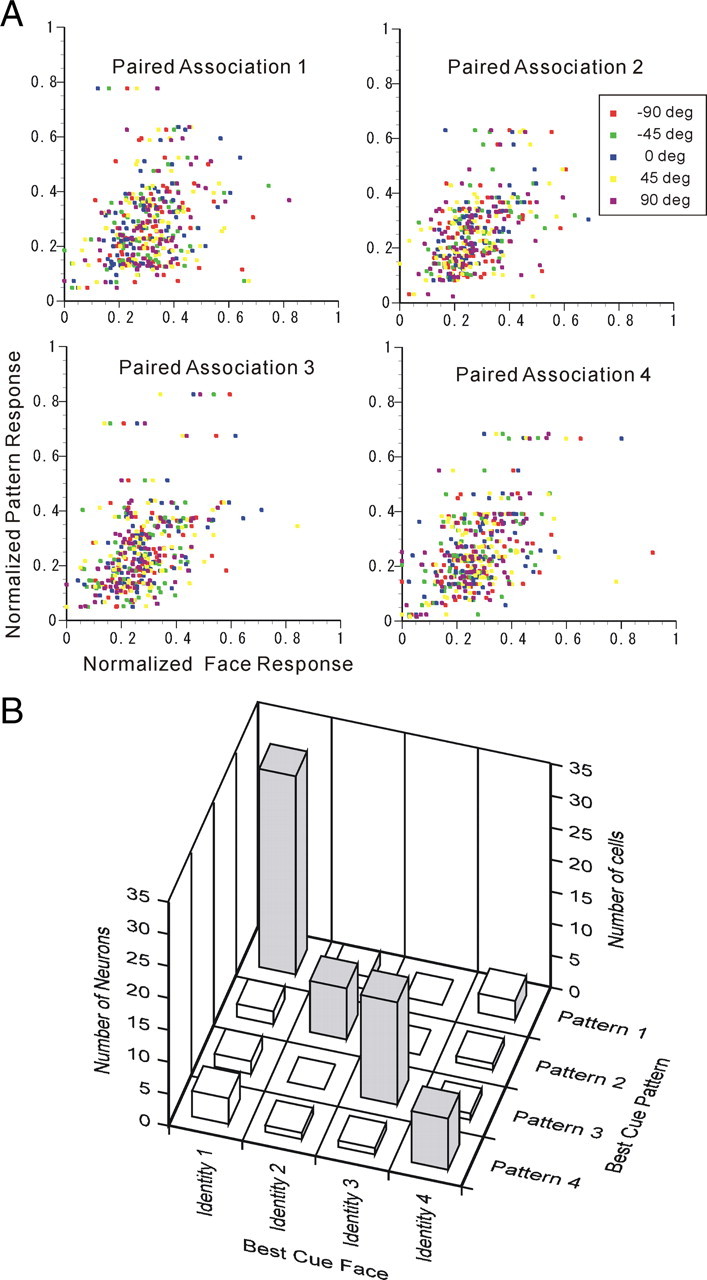
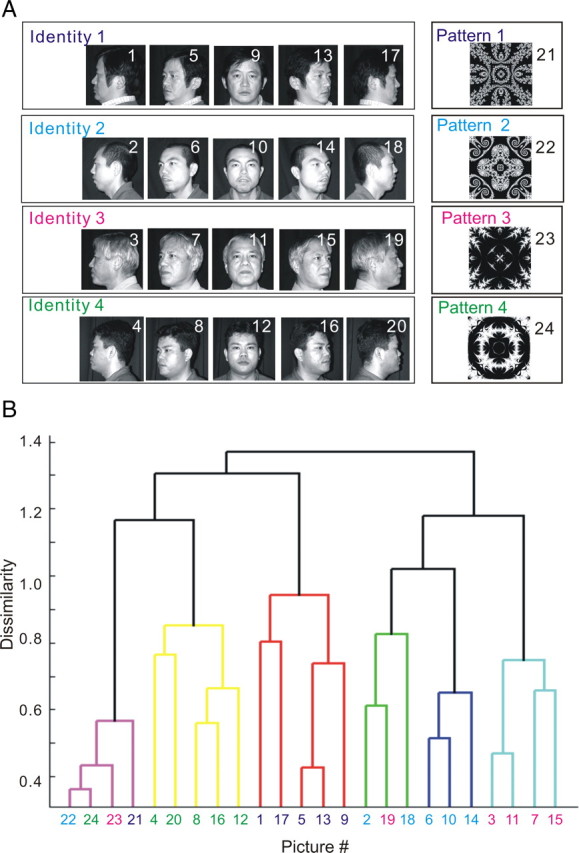
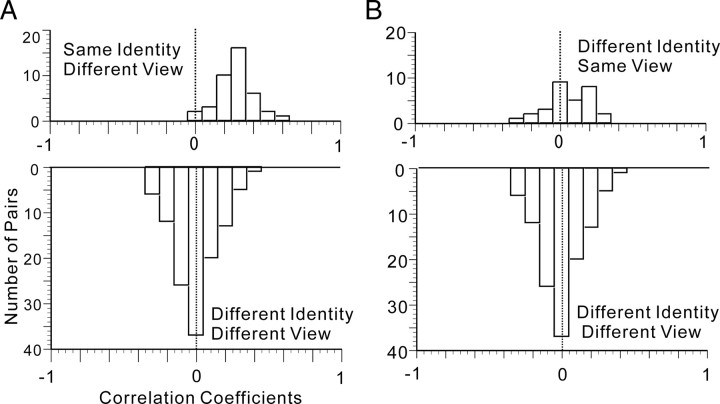
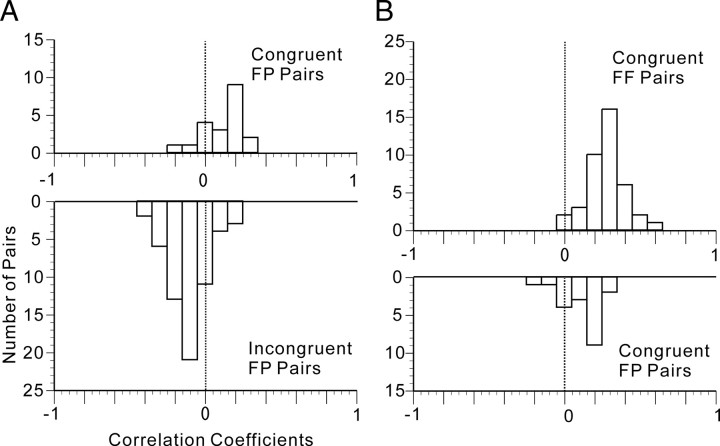
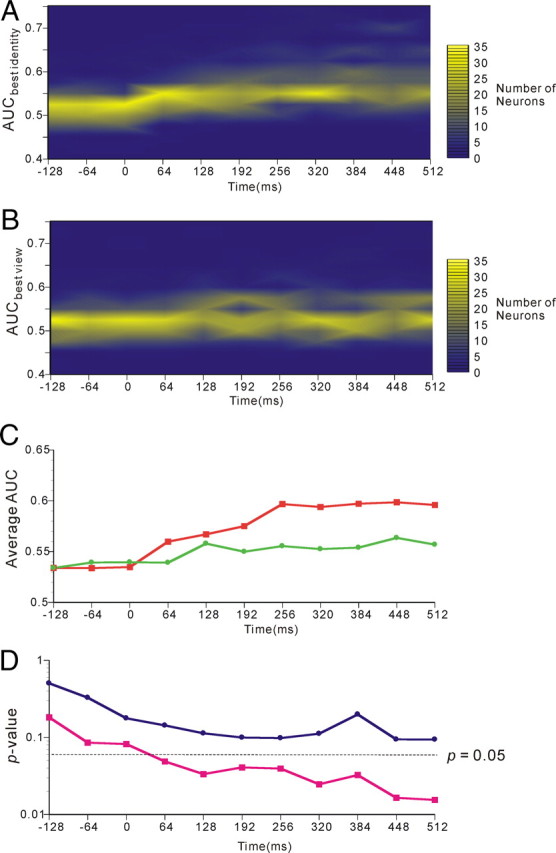
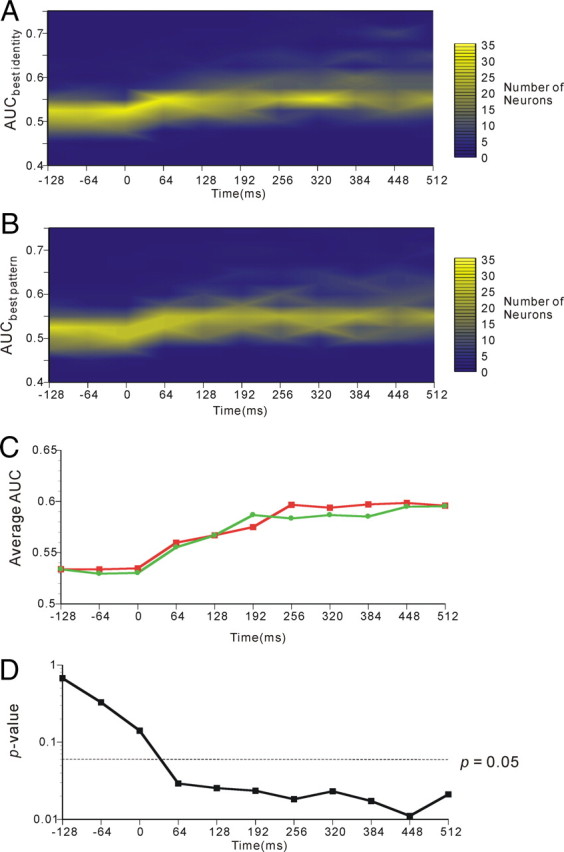
To investigate the neural basis of the associative aspects of facial identification, we recorded neuronal activity from the ventral, anterior inferior temporal cortex (AITv) of macaque monkeys during the performance of an asymmetrical paired-association (APA) task that required associative pairing between an abstract pattern and five different facial views of a single person. In the APA task, after one element of a pair (either an abstract pattern or a face) was presented as a sample cue, the reward-seeking monkey correctly identified the other element of the pair among various repeatedly presented test stimuli (faces or patterns) that were temporally separated by interstimulus delays. The results revealed that a substantial number of AITv neurons responded both to faces and abstract patterns, and the majority of these neurons responded selectively to a particular associative pair. It was demonstrated that in addition to the view-invariant identity of faces used in the APA task, the population of AITv neurons was also able to represent the associative pairing between faces and abstract patterns, which was acquired by training in the APA task. It also appeared that the effect of associative pairing was not so strong that the abstract pattern could be treated in a manner similar to a series of faces belonging to a unique identity. Together, these findings indicate that the AITv plays a crucial role in both facial identification and semantic associations with facial identities.


Figures

Figure 1.
Figure 1.
APA task. A, Four paired associations used in the APA task. Monkeys learned to associatively pair a pattern and a facial identity. Five different images of a unique face were presented to the animal from five different perspectives. B, Task sequence of a typical “pattern-to-face” trial. During fixation, a pattern cue from a paired association was presented to the animal. Then, after interstimulus delays (ISI), distractors were presented zero to three times until a face target finally appeared, to which the monkey was to respond by pushing a lever to obtain juice. C, Task sequence of a typical “face-to-pattern” trial. The temporal order of the face-to-pattern trial was reversed in the case of the pattern-to-face trial. Depicted in B and C are cases in which two distractors were presented.
Figure 2.
Figure 2.
An example of associative-pair-selective neurons. A, Neuronal activity in the pattern-to-face trials of an associative-pair-selective neuron are displayed in rasters and spike-density functions (σ = 10 ms). All graphs are aligned to the onset of the cue (left) and target (right) presentation (time 0). Differences in raster colors indicate four different paired associations; five different views are intermixed in the rasters tinted in accord with the paired associates. Dashed lines on the graphs indicate the mean firing rates during the control period (208 ms period before presentation of the cues) ± 2 SD. B, Neuronal activity in the face-to-pattern of the same neuron. The figure conventions are the same as those introduced in A. C, Summary of cue-face responses. The mean firing rates of cue-face responses to five facial views of four facial identities are coded using different colors. D, Summary of neuronal responses to cue faces (cue-face responses) in face-to-pattern trials and those to cue patterns (cue-pattern responses) in pattern-to-face trials. The panel for cue-face responses shows the mean firing rates ± SEM during the period 64–560 ms after the onset of cue presentation (cue period) for each facial identity (5 facial views are averaged in this panel). The panel for cue-pattern responses shows the mean firing rates ± SEM in the cue period for each pattern. E, ROC curve of neuronal responses to cue faces to best discriminate a particular facial identity. Of the four identities, the ROC curve with identity 1, which produced the largest AUC value, is depicted (red). Ten other ROC plots based on the surrogate data in which the relationship between stimulus and response was destroyed are also shown in blue. F, ROC curve of neuronal responses to cue faces to best discriminate a particular facial view (the +45° view). The figure conventions are the same as those introduced in E. G, ROC curve of neuronal responses to cue patterns to best discriminate a particular pattern (pattern 1). The Figure conventions are the same as those introduced in E.
Figure 3.
Figure 3.
An example of associative-pair-selective neurons. A–G, The figure conventions are the same as those in Figure 2. The ROC curves are obtained for facial identity 3, facial view ±0°, and abstract pattern 3. Error bars indicate mean ± SEM.
Figure 4.
Figure 4.
ROC analysis of individual associative-pair-responsive neurons. A, Distribution of the AUCbest identity obtained from the ROC curve to best discriminate facial identity. The dashed line on the graph indicates the mean AUCbest identity. B, Distribution of the AUCbest view obtained from the ROC curve to best discriminate facial views. The dashed line on the graph indicates the mean AUCbest view.
Figure 5.
Figure 5.
Associative-pair selectivity of individual associative-pair-responsive neurons. A, Scatter plot between cue face responses and cue-pattern responses in paired associations 1 to 4. The spontaneous activities were subtracted from the responses, and then the responses were normalized by the norm of responses to the 24 visual stimuli. Different facial views are indicated by different colors. B, Comparison between best-cue patterns and best-cue faces of the associative-pair-selective (dark; n = 63) and other responsive [white; n = 17 (80 − 63)] neurons. The diagonal positions imply that the best-cue patterns and best-cue faces were in agreement.
Figure 6.
Figure 6.
Dendrogram obtained by cluster analysis of the population of associative-pair-responsive neurons in the AITv area. A, The 20 faces (4 identities by 5 views) and four abstract patterns used in the APA task as visual stimuli. A picture number was assigned for each visual stimulus. The four paired associates are indicated by different colors. B, The dendrogram depicts the dissimilarity/similarity relationships of all visual stimuli used in the cognitive task comprised of 20 faces (4 identities by 5 views) and four abstract patterns, as obtained by a cluster analysis. In the cluster analysis, the dissimilarity of all possible stimuli pairs, as defined based on correlation coefficients between the magnitudes of cue response to each stimuli in the pair, was used for all of the associative-pair-responsive neurons recorded in the AITv (n = 80).
Figure 7.
Figure 7.
Representation of faces by the population of associative-pair-responsive neurons in the AITv area. A, The frequency distribution of correlation coefficients (r) between faces of the same identity but seen from different viewpoints (top), and of correlation coefficients (r) between faces of different identities and seen from different viewpoints (bottom). B, Frequency distribution of correlation coefficients (r) between faces seen from the same angle but of different identities (top), and of correlation coefficients (r) between faces shown from different perspectives and of different identities (bottom).
Figure 8.
Figure 8.
Representation of paired associations by a population of associative-pair-responsive neurons in the AITv area. A, Frequency distribution of correlation coefficients (r) between a face and a pattern paired as associates (congruent FP pair; top) and of correlation coefficients (r) between a face and a pattern not paired as associates (incongruent FP pair; bottom). B, Frequency distribution of correlation coefficients (r) between images of the same face seen from different viewpoints (congruent FF pair; top) and of correlation coefficients (r) between a face and a pattern paired as associates (congruent FP pair; bottom).
Figure 9.
Figure 9.
Temporal changes in AITv-area representations of facial identities In each figure, statistical analysis was performed using a 64 ms window starting −128, −64, 0, 64, 128, 192, 256, 320, 384, 448, or 512 ms after the onset of cue face presentation. A, Temporal course of the distribution of the AUCbest identity obtained by the ROC analysis performed on activities in response to cue faces of individual neurons. B, Temporal course of the distribution of the AUCbest view obtained by the ROC analysis performed on activities in response to cue faces of individual neurons. C, Temporal course of the mean of the AUCbest identity (red) and AUCbest view (green). D, Temporal course of the p value of the differences from zero of the correlation coefficients between neural responses to the faces possessing the same identity but with different views (magenta) and of the correlation coefficients between neural responses to the faces having different identities and different views (blue).
Figure 10.
Figure 10.
Temporal changes in AITv-area representations of paired associations. In each figure, statistical analysis was performed using a 64 ms window starting −128, −64, 0, 64, 128, 192, 256, 320, 384, 448, or 512 ms after the onset of cue-face or cue-pattern presentation. A, Temporal course of the distribution of the AUCbest identity obtained by the ROC analysis performed on activities in response to cue faces of individual neurons. B, Temporal course of the distribution of the AUCbest pattern obtained by the ROC analysis performed on activities in response to cue patterns of individual neurons. C, Temporal course of the mean of the AUCbest identity (red) and AUCbest pattern (green). D, Temporal course of the p value of the differences between the mean of the correlation coefficients for congruent FP pairs and the mean of the correlation coefficients for incongruent FP pairs.

References

    1. Barton JJ, Cherkasova M. Face imagery and its relation to perception and covert recognition in prosopagnosia. Neurology. 2003;61:220–225. - PubMed
    1. Barton JJ, Press DZ, Keenan JP, O'Connor M. Lesions of the fusiform face area impair perception of facial configuration in prosopagnosia. Neurology. 2002;58:71–78. - PubMed
    1. Bruce CJ, Desimone R, Gross CG. Visual properties of neurons in a polysensory area in superior temporal sulcus of the macaque. J Neurophysiol. 1981;46:369–384. - PubMed
    1. Crist CF, Yamasaki DSG, Komatsu H, Wurtz RH. A grid systems and a microsyringe for single cell recording. J Neurosci Methods. 1988;26:117–122. - PubMed
    1. Damasio AR, Damasio H, Van Hoesen GW. Prosopagnosia: anatomic basis and behavioral mechanisms. Neurology. 1982;32:331–341. - PubMed

Publication types