. 2010 Nov 10;30(45):15146-59.
doi: 10.1523/JNEUROSCI.2662-10.2010.

Dendritic sodium channels regulate network integration in globus pallidus neurons: a modeling study

Affiliations

Dendritic sodium channels regulate network integration in globus pallidus neurons: a modeling study

Jeremy R Edgerton et al. J Neurosci. .

Abstract

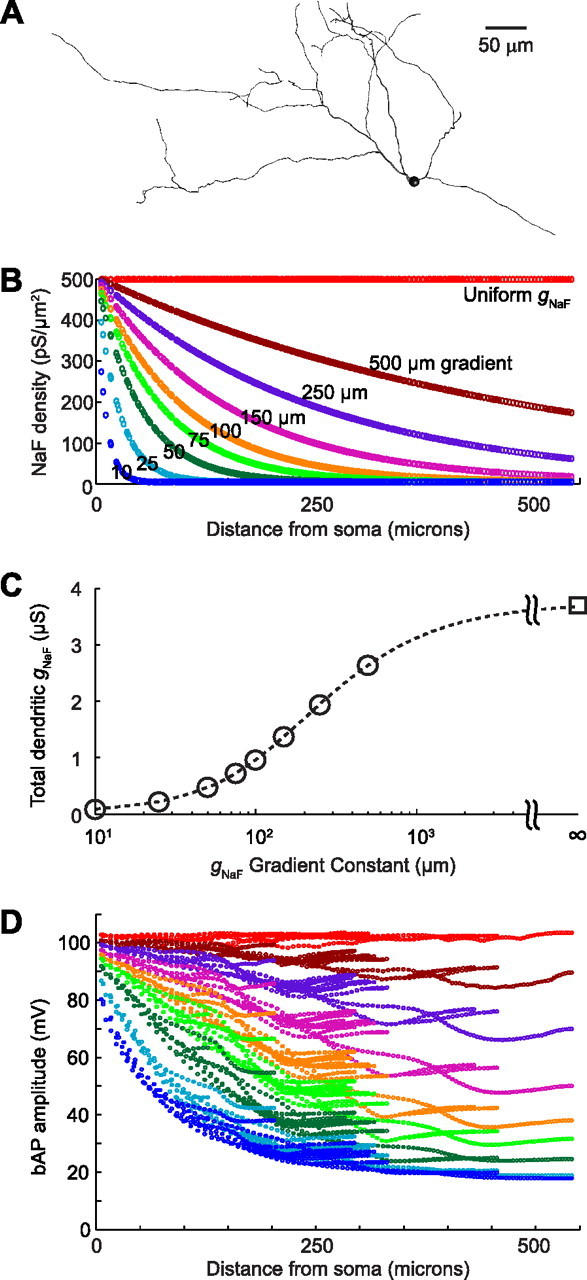
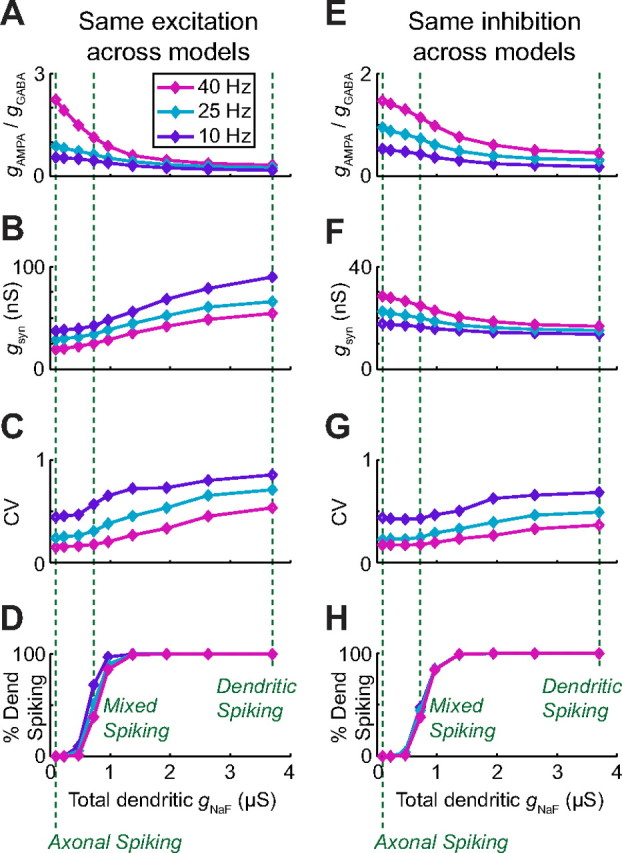
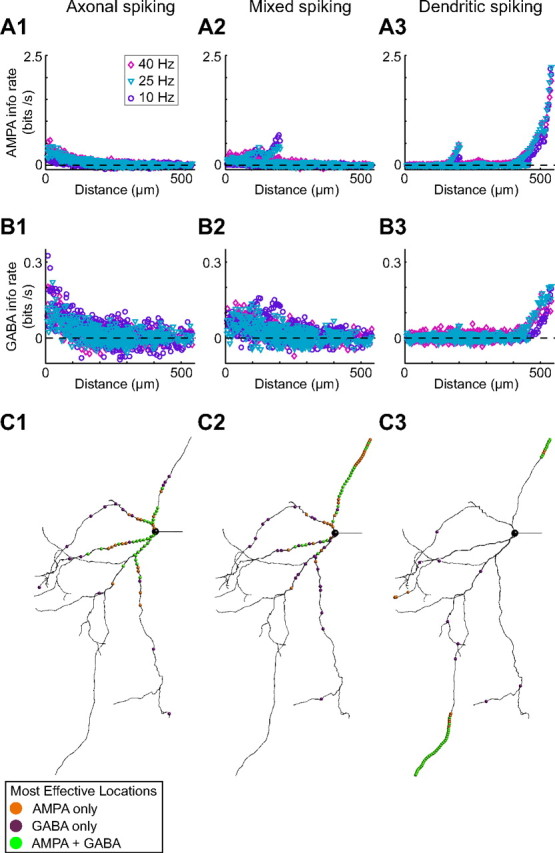
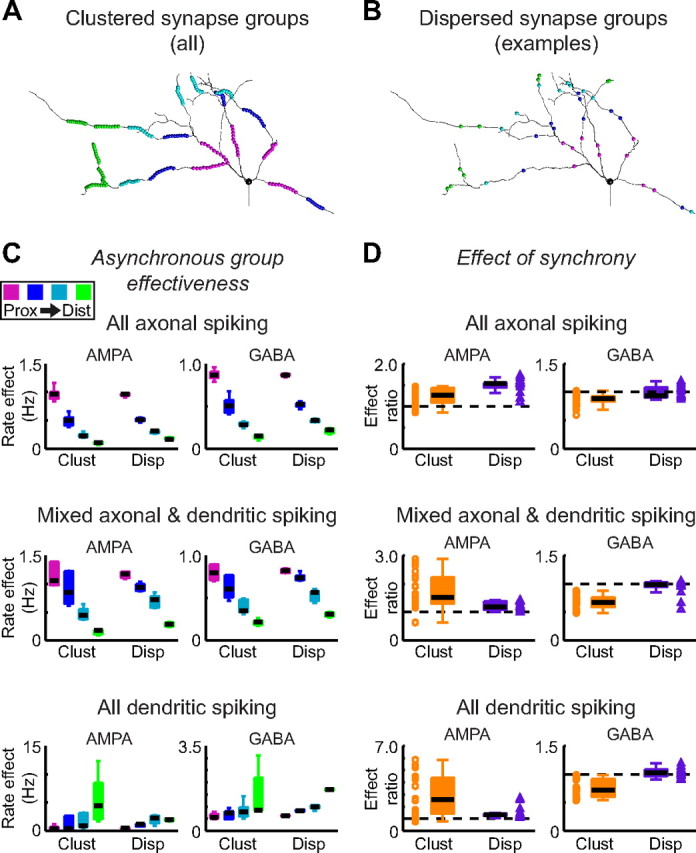
The globus pallidus (GP) predominantly contains GABAergic projection neurons that occupy a central position in the indirect pathway of the basal ganglia. They have long dendrites that can extend through one-half the diameter of the GP in rats, potentially enabling convergence and interaction between segregated basal ganglia circuits. Because of the length and fine diameter of GP dendrites, however, it is unclear how much influence distal synapses have on spiking activity. Dendritic expression of fast voltage-dependent Na(+) channels (NaF channels) can enhance the importance of distal excitatory synapses by allowing for dendritic spike initiation and by subthreshold boosting of EPSPs. Antibody labeling has demonstrated the presence of NaF channel proteins in GP dendrites, but the quantitative expression density of the channels remains unknown. We built a series of nine GP neuron models that differed only in their dendritic NaF channel expression level to assess the functional impact of this parameter. The models were all similar in their basic electrophysiological features; however, higher expression levels of dendritic NaF channels increased the relative effectiveness of distal inputs for both excitatory and inhibitory synapses, broadening the effective extent of the dendritic tree. Higher dendritic NaF channel expression also made the neurons more resistant to tonic inhibition and highly sensitive to clustered synchronous excitation. The dendritic NaF channel expression pattern may therefore be a critical determinant of convergence for both the striatopallidal and subthalamopallidal projections, while also dictating which spatiotemporal input patterns are most effective at driving GP neuron output.


Figures

Figure 1.
Figure 1.
Properties of the model GP neurons. Nine model neurons were compared. A, They all shared the same morphology, which was reconstructed from a biocytin-filled rat GP neuron. They also shared the same biophysical parameters and ion channel densities with one exception: the density of the fast sodium conductance (gNaF) in the dendrites. B, For each of the gradient distributions, gNaF started at the somatic level of 500 pS/μm2 and approached a minimum of 5 pS/μm2 as an exponential function of distance from the soma. C, The differential dendritic gNaF patterns resulted in total summed dendritic gNaF levels ranging from 0.09 to 3.70 μS. D, The backpropagation of spontaneous action potentials was strongly affected by the dendritic gNaF expression level, but bAPs still reached the most distal dendritic tips at nearly 20 mV, even in the model neuron with the lowest gNaF level.
Figure 2.
Figure 2.
Realistic GP neuron physiology is observed for a wide range of dendritic gNaF levels. A, Simulation traces of spontaneous and current-driven (+100 pA into the soma during the underlined periods) spiking are shown for the model neurons with gNaF gradient constants of 75 μm (top left) and 250 μm (bottom left). The most apparent difference between the two was in the shape of the AHP following each spike. Voltage traces from two GP neuron brain slice recordings are shown (right) simply to illustrate the point that real GP neurons can have more rounded or sharp AHP shapes resembling the different model neurons. B, A comparison of spontaneous spike shapes between all of the model neurons revealed a direct connection between the dendritic gNaF level and the depth of the spike AHP, with a higher dendritic gNaF level resulting in a deeper spike AHP (left). Slice recordings of spontaneous action potentials from 46 GP neurons show that the set of model neurons spanned the whole range of typical GP neuron variability in this characteristic (right; to show AHP variability more directly, the inset shows the same traces vertically shifted so that all were at −50 mV 2 ms before the peak of the spike). C, The frequency responses of the nine model neurons to somatic current injections were very similar for current amplitudes between −200 and +200 pA (left). For larger positive current injections, model neurons with lower dendritic gNaF were more prone to depolarization block. GP neurons from slice recordings showed a similar average frequency-current response and also varied in their tendency to enter depolarization block at higher current levels (right). Some recordings do not show data points above +100 pA current injection because such data were not obtained for these neurons.
Figure 3.
Figure 3.
A–F, Rate-based input-output curves for background excitation (A–C) and inhibition (D–F) demonstrate a selective effect of dendritic sodium channels on excitatory input transfer. Whether there was no inhibition (A), a fixed level of inhibition common to all model neurons (B; 2555 total inhibitory inputs per second, 0.5 Hz per biological synapse; see Materials and Methods), or inhibition that increased in tandem with the dendritic gNaF level (C; inhibition rates were set independently for each model to achieve an output spike rate of 25 Hz; the excitation rate was 5110 events per second, 6.4 Hz per synapse), sensitivity to excitatory input was enhanced by dendritic NaF channels. By contrast, the influence of inhibition was very similar across model neurons whether there was no excitation (D), a fixed level of excitation (E; 2044 events per second; 2.6 Hz per synapse for all models), or variable levels of excitation adjusted so that all model neurons initially fired at 40 Hz (F). The insets in D and E show the same data plotted as the decrease in rate relative to the initial rate (at 0 inhibition), illustrating that inhibition was affecting all of the models about the same. The inset in F shows the same data as the main panel, but only for the models with the highest (red) and lowest (blue) dendritic gNaF levels.
Figure 4.
Figure 4.
A–C, Simulated voltage traces are shown from three of the model neurons: the model with the lowest dendritic gNaF, in which action potential initiation occurred exclusively in the axon initial segment (A); a model with an intermediate level of dendritic gNaF, which showed a mixture of axonal and dendritic initiation (B); and the uniform dendritic gNaF model, in which spike initiation was almost exclusively dendritic (C). Traces are from simulations where all three models received the same background excitatory input (5110 events per second, 6.4 Hz per biological synapse; see Materials and Methods) while the background inhibitory input rate was adjusted independently for each to attain an output spike rate of 25 Hz. The inhibition rates used were 1150 events per second (0.2 Hz per synapse) for the axonal-spiking model, 2146 events per second (0.4 Hz per synapse) for the mixed-spiking model, and 6720 events per second (1.2 Hz per synapse) for the dendritic-spiking model. The average membrane potential values for the three simulations were −49.2, −52.3, and −63.5 mV. The dashed line in each is at −60 mV. The differences in spike timing variability between the models are readily apparent in the ISI distributions (gray) and autocorrelation histograms (black) shown on the right.
Figure 5.
Figure 5.
Dendritic sodium channels enhance spike-time variability across a wide range of high-conductance input conditions. For each of the nine model neurons, excitatory and inhibitory synapses were uniformly distributed in all dendritic compartments and activated randomly. A–D, In some simulations, the excitatory rate was the same for all models (10,220 synaptic events per second, 13 Hz per biological synapse; see Materials and Methods) while inhibition was varied independently for each model neuron to achieve output spike rates of 10, 25, and 40 Hz. E–H, In a different set of simulations, the model neurons all received identical inhibition (3066 events per second; 0.6 Hz per synapse), while excitation was adjusted independently to reach the same output rates. In both cases the ratio of excitatory to inhibitory conductance that gave the desired output spike rate was inversely related to the dendritic gNaF (A, E). As a result, when excitation was the same for all models, those with more dendritic gNaF required much more total synaptic conductance to achieve a specified spike rate because they received more inhibition (B). When inhibition was kept the same for all models, those with less dendritic gNaF received the most total synaptic conductance, because they required more excitation (F). Despite the large differences in input conditions between these two sets of simulations, the model neurons with the highest gNaF levels always had the highest variance in their spike timing as measured by the coefficient of variation of the interspike interval distribution (C, G). For both sets of simulations, the percentage of somatic action potentials that initiated in the dendrites as opposed to the axon of each model neuron was only moderately affected by the input conditions, and the nine model neurons spanned the whole range from purely axonal spike initiation to 100% dendritic spike initiation (D, H). Three of the nine model neurons (vertical dashed lines; same models as shown in Fig. 4) were selected to represent different spike initiation cases for additional analysis: one with purely axonal spike initiation, one with a mixture of axonal and dendritic spike initiation, and one with 100% dendritic spike initiation.
Figure 6.
Figure 6.
Dendritic NaF channels enhance the efficacy of distal locations for both AMPA and GABA inputs. Mutual information rates were estimated for the background AMPA and GABA inputs in each dendritic compartment while all input events occurred randomly (see Materials and Methods). For each model, information rates at each input location were compared at three different levels of inhibition yielding three different output spike rates: 10, 25, and 40 Hz. A1, B1, For the axonal-spiking model, the inputs that had the greatest effect on output spiking were consistently those closest to the soma, and this was true for both AMPA and GABA inputs. A2, B2, For the mixed-spiking model, there was still a clear preference for proximal locations over distal ones, but the most effective AMPA inputs were on a single dendritic branch between 150 and 200 μm from the soma. A3; B3, The dendritic-spiking model showed the opposite relationship between location and efficacy: the most distal locations were by far the most effective at controlling output, and this was true for both AMPA and GABA inputs. C, For the medium inhibition simulations (25 Hz output spiking), the 50 compartments with the greatest mutual information rates are highlighted by colored spheres to show where they were located on the dendritic tree. For each model neuron, the dendritic compartments where AMPA inputs were most effective tended to be the same compartments where GABA inputs were most effective. In the axonal-spiking model (C1), 33 of the top 50 AMPA input locations were colocalized with a top-50 GABA input location. For the mixed-spiking (C2) and dendritic-spiking (C3) models, the top 50 AMPA and GABA input locations were colocalized in 23 and 40 cases, respectively. The background excitation rate was fixed at 10,220 events per second (13 Hz per biological synapse; see Materials and Methods) for all simulations while the background inhibition rate was varied for each model to obtain the three target spike rates. For the axonal spiking model, the background inhibition rates that produced 10, 25, and 40 Hz output were as follows: 6388 events per second (1.2 Hz per synapse), 4037 events per second (0.75 Hz per synapse), and 1584 events per second (0.3 Hz per synapse). For the mixed spiking model, the background inhibition rates were 7742 events per second (1.4 Hz per synapse), 5544 events per second (1.0 Hz per synapse), and 3117 events per second (0.6 Hz per synapse). For the dendritic spiking model, the background inhibition rates were 20,312 events per second (3.76 Hz per synapse), 13,976 events per second (2.6 Hz per synapse), and 10,884 events per second (2.0 Hz per synapse).
Figure 7.
Figure 7.
A, B, The effects of dendritic sodium channel expression on the integration of multiple synapses was investigated by placing synapses into groups of 10 dendritic compartments that were either spatially clustered on a small region of dendrite (A, all 20 groups shown, each color is a distance range) or dispersed over a wide dendritic area (B, 18 groups total; each color shows a single example group from one distance range). Within each test group, all 10 compartments were at a similar electrotonic distance from the soma (see Materials and Methods). The test groups were composed of excitatory AMPA synapses in some simulations and inhibitory GABA synapses in others. Only one test group was active per simulation, with a high-conductance synaptic background also present. The change in the model's output spike rate when a group was active versus when it was inactive (identical synaptic background still present) was taken as the measure of the group's effectiveness. C, When the 10 synapses in the group were activated at the same rate (AMPA groups, 20 Hz per synapse; GABA groups, 10 Hz per synapse) but with random and uncorrelated timing (“asynchronous” case), the main factors determining the group's effectiveness were its distance from the soma and the dendritic gNaF level of the recipient neuron. In all cases there was a significant (p < 0.01, KW test) effect of distance on group effectiveness, regardless of the synapse type (AMPA, left; GABA, right) or spatial organization (clustered, dispersed). However, there was a clear proximal more than distal bias in the axonal and mixed spiking models and a distal more than proximal bias in the dendritic spiking model, similar to what we observed with individual inputs in Figure 6. There were no significant differences between clustered and dispersed groups of inputs when the synapses were asynchronous. AMPA groups always increased the spike rate, and GABA groups always decreased the spike rate, so the absolute values are plotted to emphasize the similarity of the results for the two types of synapses. D, The effects of input synchrony were tested with each synapse group by having the 10 synapses activated with the same rates as before and with random timing, but with all 10 synapses coactivated at the same random times. The effect of synchrony was then measured as the ratio of the group's effectiveness when synchronous (model spike rate with synchronous group active minus model spike rate with synaptic background only) compared to when asynchronous (values in C); values >1.0 therefore indicate that synchrony enhanced effectiveness, and values <1.0 indicate that synchrony reduced effectiveness. The dashed black line on each plot shows where a ratio of 1.0 would be. Scatter data show all of the data points, whereas the box plots show the median (thick black line), upper, and lower quartiles (box boundaries), and the whiskers extend to the most extreme data point within 1.5 times the interquartile range for each data set. For the groups of AMPA inputs, synchrony significantly increased the effectiveness for all three models and for both clustered and dispersed groups (p < 0.01, WSR test). The largest effects of synchrony were always associated with clustered groups in models that were capable of local dendritic spike initiation, demonstrating a particular sensitivity of dendritic spiking models to clustered, synchronous excitation. In contrast, synchrony significantly reduced the effectiveness of clustered GABA synapse groups in all three models (p < 0.01, WSR test), whereas synchrony did not significantly impact dispersed GABA groups in any of the models. Background synaptic activity levels were adjusted as described for Figure 6 (supplemental Methods, available at www.jneurosci.org as supplemental material).

Similar articles

Cited by

References

    1. Acker CD, Antic SD. Quantitative assessment of the distributions of membrane conductances involved in action potential backpropagation along basal dendrites. J Neurophysiol. 2009;101:1524–1541. - PMC - PubMed
    1. Bernard V, Bolam JP. Subcellular and subsynaptic distribution of the NR1 subunit of the NMDA receptor in the neostriatum and globus pallidus of the rat: co-localization at synapses with the GluR2/3 subunit of the AMPA receptor. Eur J Neurosci. 1998;10:3721–3736. - PubMed
    1. Bevan MD, Booth PA, Eaton SA, Bolam JP. Selective innervation of neostriatal interneurons by a subclass of neuron in the globus pallidus of the rat. J Neurosci. 1998;18:9438–9452. - PMC - PubMed
    1. Bischofberger J, Jonas P. Action potential propagation into the presynaptic dendrites of rat mitral cells. J Physiol. 1997;504:359–365. - PMC - PubMed
    1. Burkhardt JM, Constantinidis C, Anstrom KK, Roberts DC, Woodward DJ. Synchronous oscillations and phase reorganization in the basal ganglia during akinesia induced by high-dose haloperidol. Eur J Neurosci. 2007;26:1912–1924. - PubMed

Publication types

Substances

LinkOut - more resources