. 2010 Nov 10;30(45):15210-20.
doi: 10.1523/JNEUROSCI.3950-10.2010.

Activation of microglia depends on Na+/H+ exchange-mediated H+ homeostasis

Affiliations

Activation of microglia depends on Na+/H+ exchange-mediated H+ homeostasis

Yan Liu et al. J Neurosci. .

Abstract

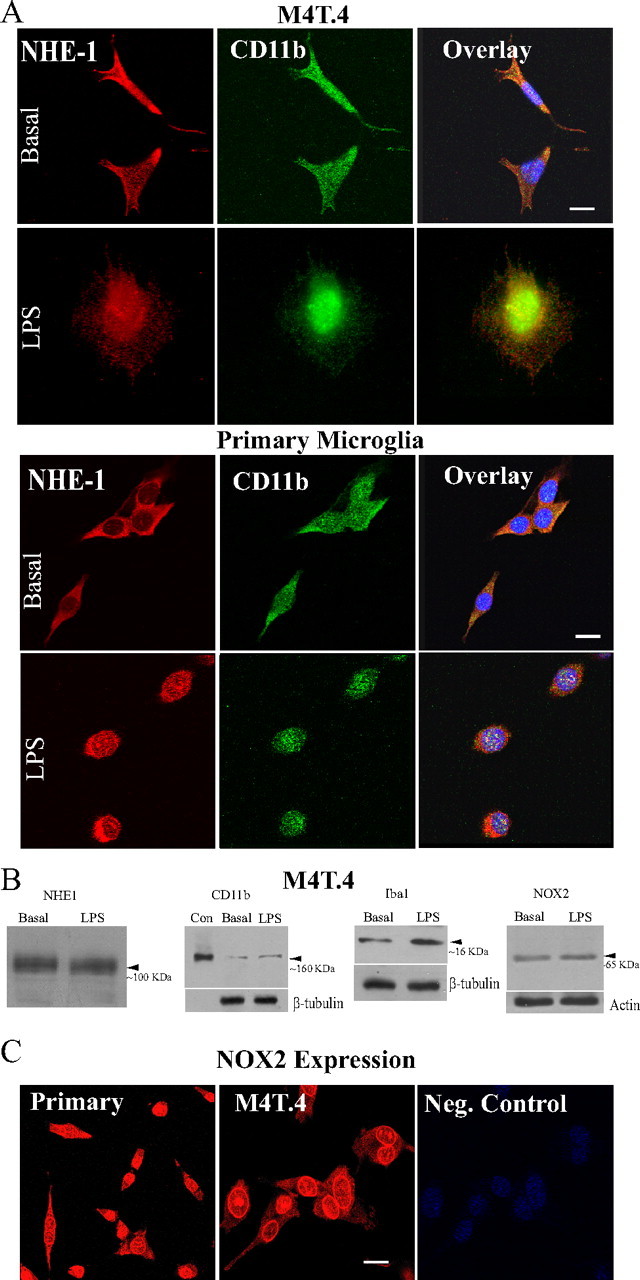
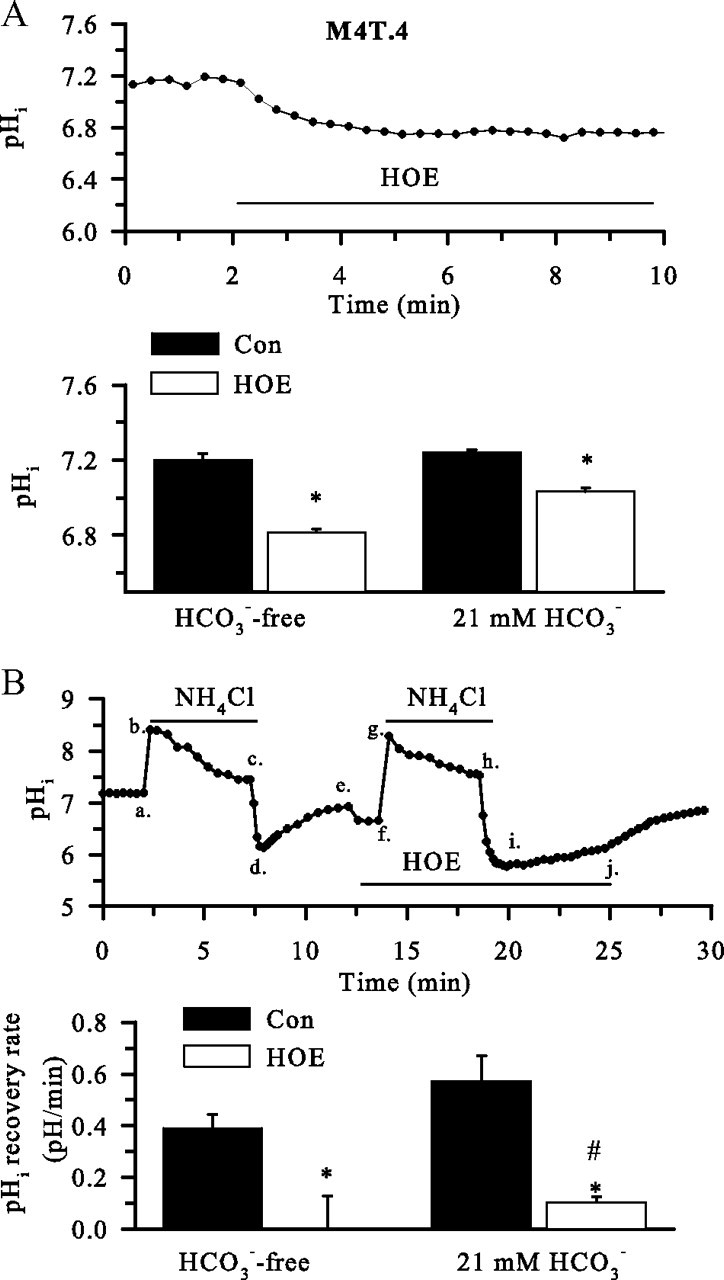
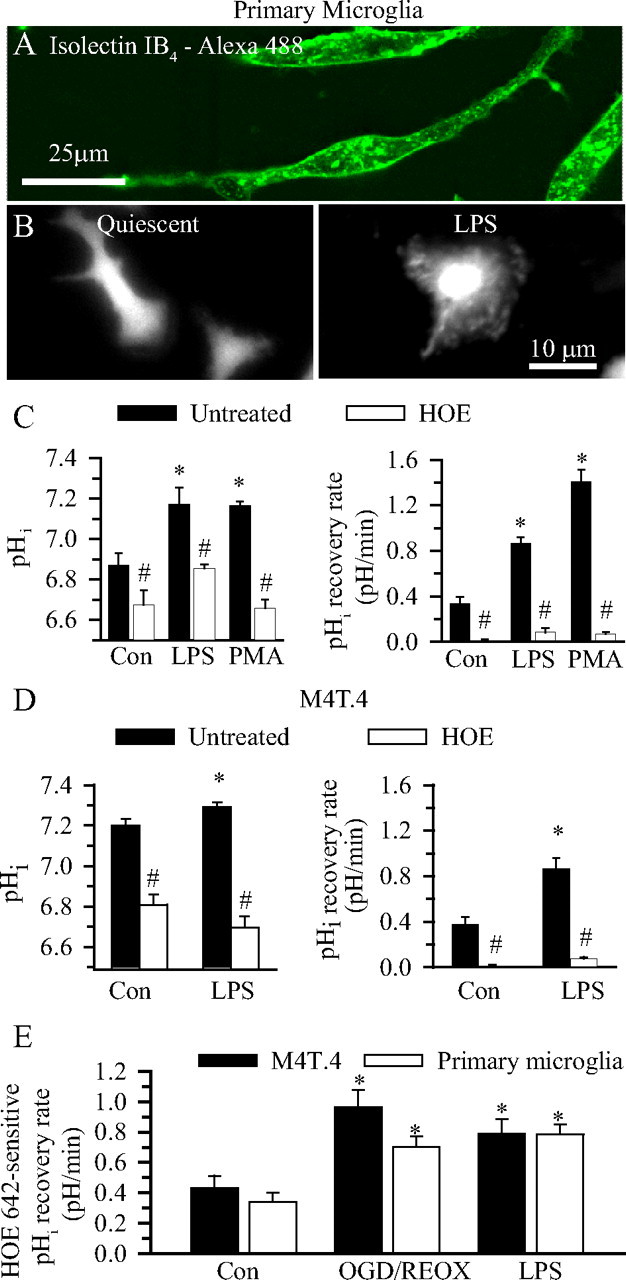
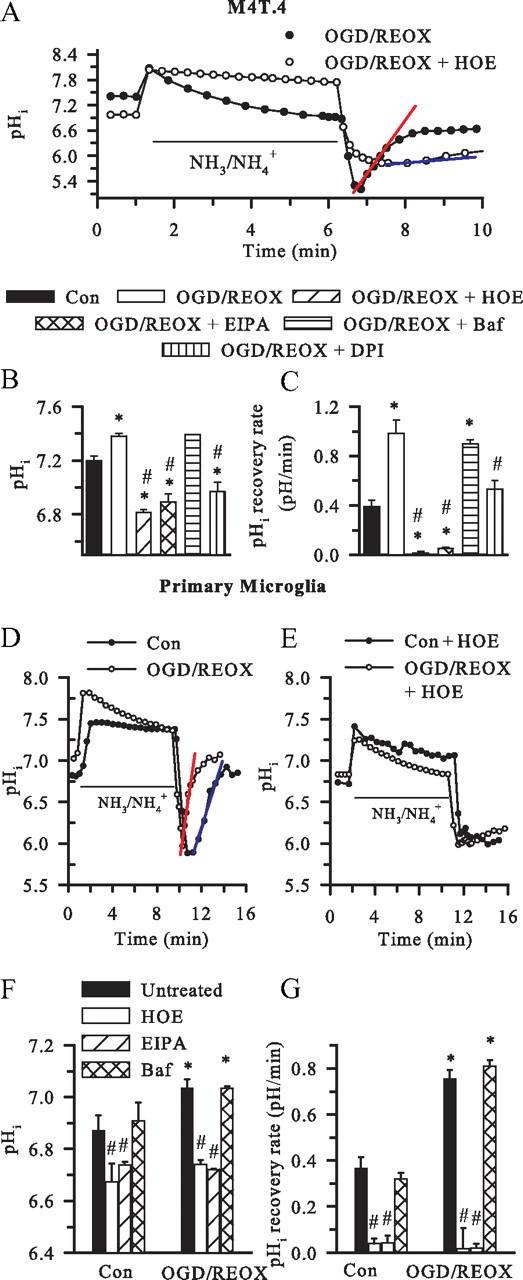
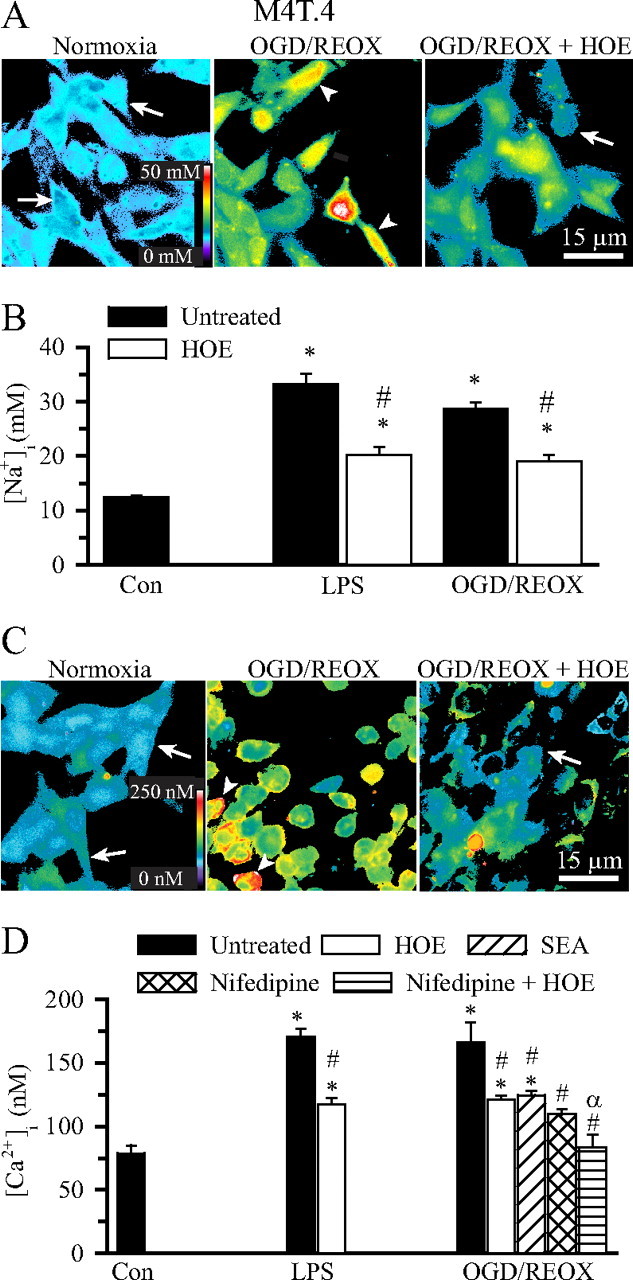
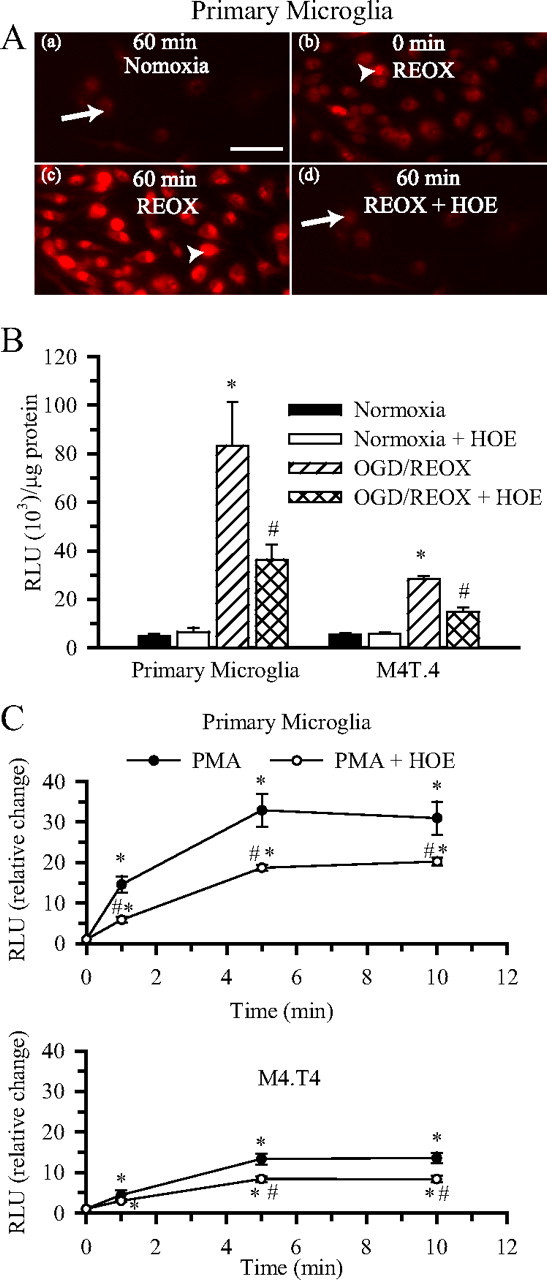
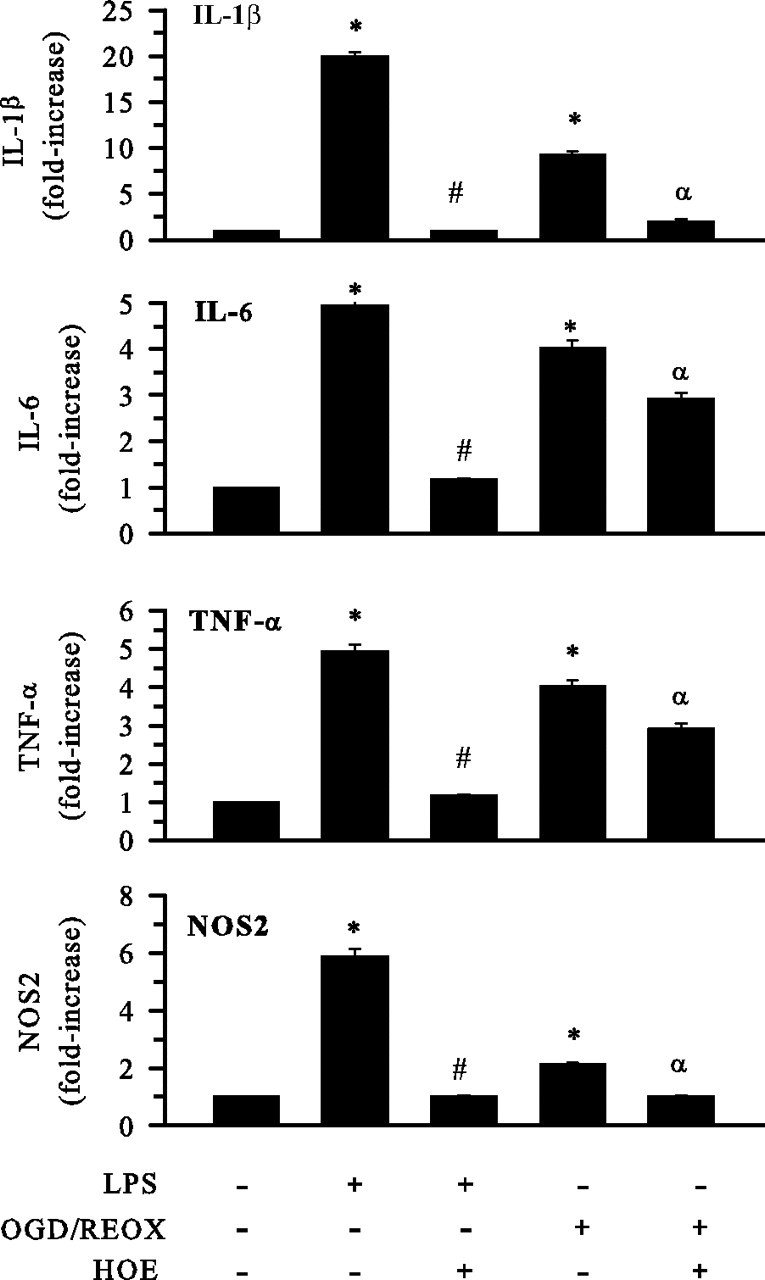
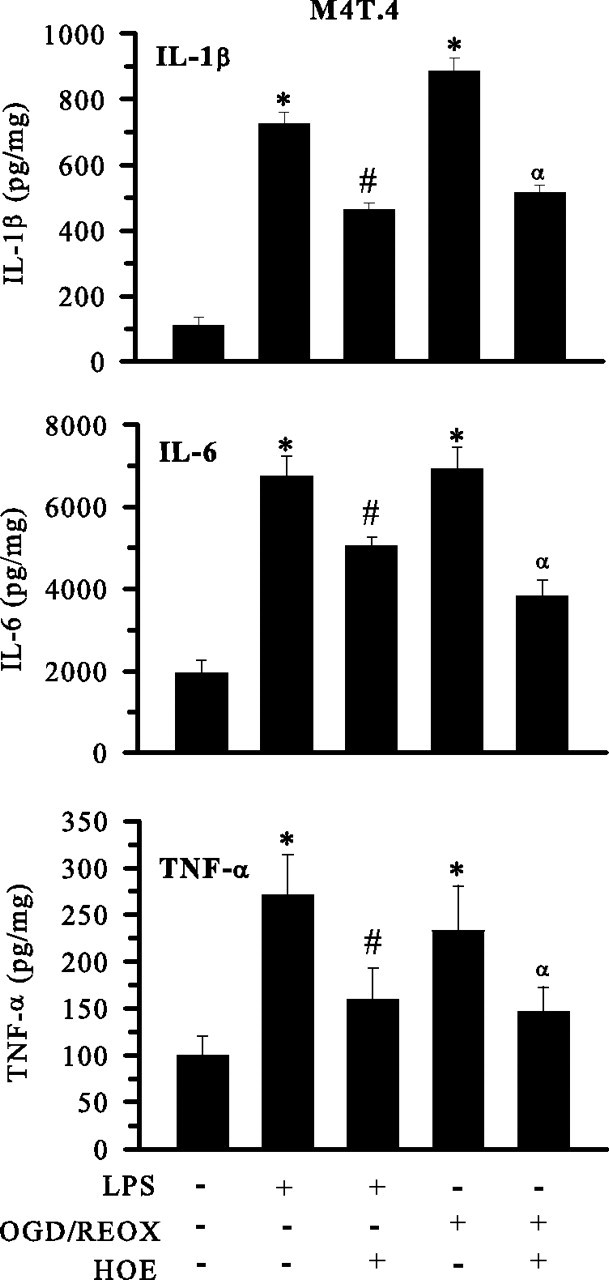
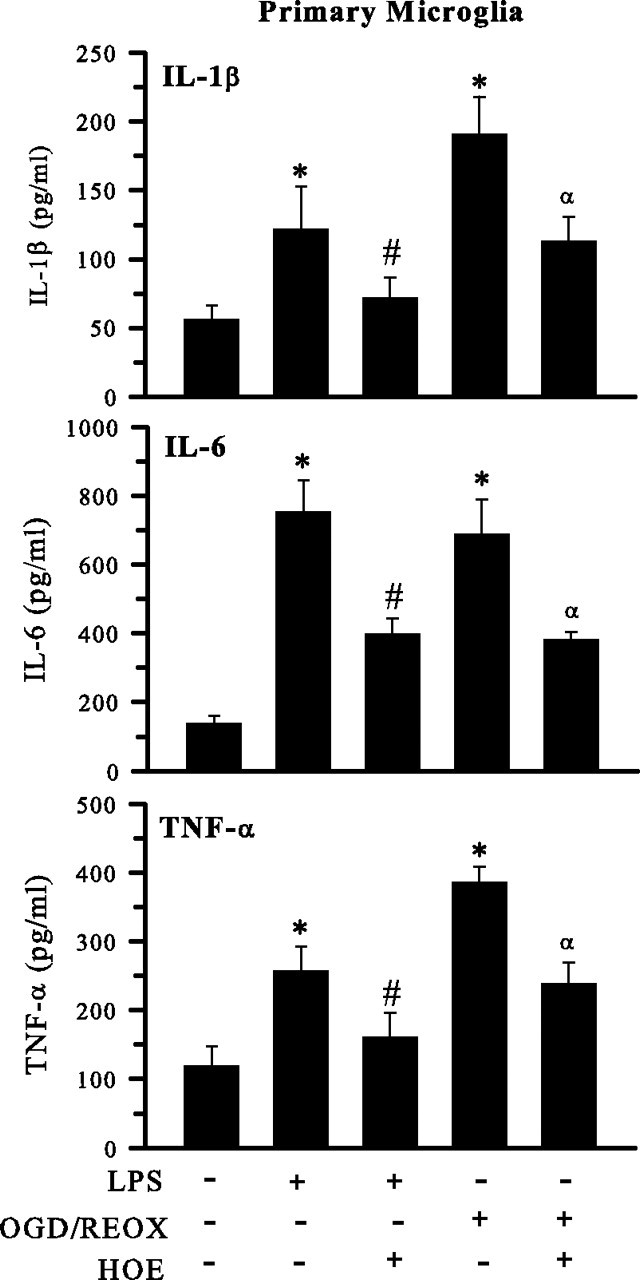
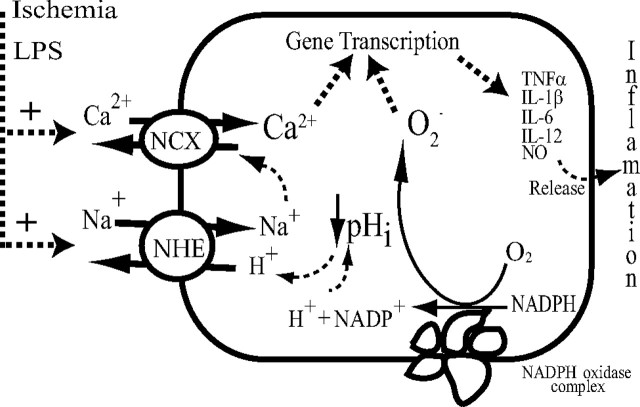
H(+) extrusion is important for sustained NADPH oxidase activation after "respiratory" burst in macrophage/microglia activation. In this study, we investigated the role of Na(+)/H(+) exchanger isoform 1 (NHE-1) in activation of microglia after lipopolysaccharide (LPS) or oxygen and glucose deprivation and reoxygenation (OGD/REOX) exposure. NHE-1 functioned in maintaining basal pH(i) of immortalized M4T.4 microglia or mouse primary microglia. Pharmacological inhibition of NHE-1 activity with the potent inhibitor cariporide [HOE 642 (4-isopropyl-3-methylsulfonyl-benzoyl-guanidine-methanesulfonate)] abolished pH(i) regulation in microglia under basal conditions. Activation of microglia either by LPS, phorbol myristate acetate, or OGD/REOX accelerated pH(i) regulation and caused pH(i) elevation, which was accompanied with an increase in [Na(+)](i) and [Ca(2+)](i) as well as production of superoxide anion and cytokines. Interestingly, inhibition of NHE-1 not only abolished pH(i) regulation but also reduced production of superoxide anion as well as expression of cytokines and inducible nitric oxide synthase. Together, these results reveal that there was a concurrent activation of NHE-1 in microglia in response to proinflammatory stimuli. The study suggests that NHE-1 functions to maintain microglial pH(i) homeostasis allowing for sustained NADPH oxidase function and "respiratory" burst.


Figures

Figure 1.
Figure 1.
Expression of NHE-1 and CD11b in microglia. A, M4T.4 microglia and primary microglia expressed NHE-1 protein (red) and CD11b protein (green) at basal and stimulated conditions (LPS, 500 ng/ml, 24 h). Scale bar, 15 μm. B, NHE-1, CD11b, Iba 1, or NOX2 were detected in M4T.4 microglia with immunoblotting under basal conditions or after stimulation with LPS. CD11b-positive control (Con) was whole-cell lysates from a mouse leukemic monocyte macrophage cell line (Abcam). Either β-tubulin or actin was probed as a loading control. C, Expression of NOX2 protein in primary and M4T.4 microglia was visualized by immunostaining with an anti-NOX2/gp91phox antibody (red). Scale bar, 15 μm.
Figure 2.
Figure 2.
NHE-1 in regulation of basal pHi in M4T.4 microglia. A, Changes of pHi. Top, Representative trace of pHi showing response to the application of 1 μm HOE 642 over 8 min. Bottom, Baseline pHi and pHi after 8 min of treatment with 1 μm HOE 642 in the absence or presence of HCO3. Data are mean ± SEM. n = 3–4. *p < 0.05 versus control (Con). B, Representative trace of pHi changes from a prepulse experiment in the presence or the absence of HOE 642 (1 μm). Cells were exposed to 30 mm NH4Cl for 5 min (a–c) and then returned to standard HCO3-free HEPES-buffered solution (c–e), and the pHi recovery was monitored (d, e). The prepulse was repeated in the presence of HOE 642 (f–h), and the pHi recovery was monitored (i, j). pHi recovery rate during the first minute after prepulse acidification was calculated. In the experiments, the solutions were supplemented with 21 mm HCO3/5% CO2 and 5 mm HEPES. Data are mean ± SEM. n = 5–6. *p < 0.05 versus control; #p < 0.05 versus HCO3.
Figure 3.
Figure 3.
NHE-1 activity in activated microglia. A, Isolectin IB4-loaded primary microglia. B, BCECF-loaded images of primary microglia. Left, Control conditions. Right, Twenty-four hours of 100 ng/ml LPS. C, Primary microglia were subjected to 24 h of LPS stimulation (100 ng/ml) or 1 h of PMA (100 nm) stimulation in either the presence or absence of HOE 642 (1 μm). Βasal pHi and pHi regulation after the NH4+/NH3 prepulse were determined. Data are mean ± SEM. n = 3–5. *p < 0.05 versus control (Con); #p < 0.05 versus untreated. D, Changes in pHi of M4T.4 microglia after LPS stimulation (left). The cells were incubated with LPS (100 ng/ml) for 24 h in either the presence or absence of HOE 642 (1.0 μm). Data are mean ± SEM. n = 6–7. *p < 0.05 versus control; #p < 0.05 versus untreated. pHi regulation in M4T.4 cells after the NH4+/NH3 prepulse was shown in the right. Data are mean ± SEM. n = 6–7. *p < 0.05 versus control. #p < 0.05 versus untreated. E, HOE 642-sensitive pHi regulation was calculated under control, 2 h OGD/1 h REOX, or LPS conditions. Data are mean ± SEM. n = 6–7. *p < 0.05 versus control.
Figure 4.
Figure 4.
Stimulation of NHE-1 activity in microglia after OGD/REOX. A, Representative traces of pHi during the NH4+/NH3 prepulse in M4T.4 microglia after 2 h OGD and 60 min REOX. In the HOE 642 experiments, the drug was present only during 60 min REOX. Red line, pHi recovery rate in OGD/REOX control cells. Blue line, pHi recovery rate in OGD/REOX plus HOE 642-treated cells. Con, Control. B, Summary of pHi in M4T.4 microglia. In the drug treatment experiments, HOE 642 (1 μm), EIPA (100 μm), bafilomycin (1 μm), or DPI (1 μm) was present during REOX only. C, pHi recovery rate after NH4+/NH3 prepulse in M4T.4 microglia. Data are mean ± SEM. n = 3–10. *p < 0.05 versus control; #p < 0.05 versus OGD/REOX. D, Representative traces of pHi recovery in primary microglia after 2 h OGD and 60 min REOX. E, pHi recovery in primary microglia when NHE-1 activity was inhibited. The HOE 642 (1.0 μm) was only present during 60 min REOX. F, pHi changes in primary microglia. G, pHi regulation in primary microglia after the NH4+/NH3 prepulse. Data are mean ± SEM. n = 3–5. *p < 0.05 versus control; #p < 0.05 versus untreated .
Figure 5.
Figure 5.
Elevation of [Na+]i and [Ca2+]i in activated M4T.4 microglia. A, Representative SBFI pseudocolored images of changes in [Na+]i in M4T.4 microglia under normoxia, 2 h OGD/60 min REOX, or 2 h OGD/60 min REOX plus HOE 642. HOE 642 (1.0 μm) was present only during 60 min REOX. Arrow, Low [Na+]i; arrowhead, elevated [Na+]i. B, Changes in [Na+]i after either 24 h LPS treatment (500 ng/ml) or 2 h OGD and 60 min REOX. Data are mean ± SEM. n = 3–7. *p < 0.05 versus control (Con). #p < 0.05 versus OGD/REOX. C, Representative fura-2 pseudocolored images of changes in [Ca2+]i in M4T.4 microglia. Arrow, Low [Ca2+]i; arrowhead, elevated [Ca2+]i. D, Changes in [Ca2+]i in M4T.4 microglia. Nifedipine (5 μm) or SEA0400 (1 μm) was present during 0–60 min REOX to inhibit L-type Ca2+ channel or the reverse-mode operation of Na+/Ca2+ exchange, respectively. Data are mean ± SEM. n = 4–7. *p < 0.05 versus control; #p < 0.05 versus OGD/REOX; αp < 0.05 versus OGD/REOX plus HOE 642.
Figure 6.
Figure 6.
Role of NHE-1 in superoxide anion production in activated microglia. A, Changes in DHE staining in primary microglia at 60 min normoxia (a), 2 h OGD (b), 60 min REOX (c), or 60 min REOX plus 1.0 μm HOE 642 (d). Arrow, Diffused DHE staining; arrowhead, increased DHE staining primarily localized to the nucleus. All images were collected using identical acquisition parameters. Scale bar, 15 μm. B, Superoxide production was determined using the Diogenes kit under normoxic conditions or after 2 h OGD and 60 min REOX. HOE 642 (1.0 μm) was present only during REOX to selectively inhibit NHE-1 activity. RLU per microgram values were expressed. Data are mean ± SEM. n = 3. *p < 0.05 versus normoxia; #p < 0.05 versus OGD/REOX. C, PMA-mediated superoxide production was determined at 1, 5, and 10 min after stimulation with 100 nm PMA. In the HOE 642 experiments, 1.0 μm HOE 642 was added 20 min before and throughout the PMA exposure. RLU per micrograms per seconds values were normalized to the untreated values and expressed as relative change. Data are mean ± SEM. n = 3–6. *p < 0.05 versus 0 min; #p < 0.05 versus PMA alone.
Figure 7.
Figure 7.
Inhibition of NHE-1 activity reduces cytokines and NOS2 mRNA levels in activated microglia. Expression of mRNA for innate immune cytokines and NOS2 was determined in M4T.4 cells after either 24 h LPS treatment (500 ng/ml) or 24 h REOX after 2 h OGD. HOE 642 at 1 μm was present during 24 h LPS or REOX treatment. Real-time PCR was conducted with primers specific for IL-1β, IL-6, TNF-α, or NOS2. The mRNA expression was measured in femtograms after normalization and based on a standard curve for each primer pair. Relative changes in mRNAs are shown. Data are mean ± SD. n = 3. *p < 0.05 versus normoxic control; #p < 0.05 versus LPS treatment; αp < 0.05 versus OGD/REOX.
Figure 8.
Figure 8.
Inhibition of NHE-1 activity reduces cytokine release from activated M4T.4 microglia. Release of innate immune cytokines was determined in M4T.4 cells after either 24 h LPS treatment (500 ng/ml) or 24 h REOX after 2 h OGD. HOE 642 at 1 μm was present during 24 h LPS or REOX treatment. Levels of released cytokines are expressed in picograms per milligram protein. Data are mean ± SD. n = 3. *p < 0.05 versus normoxic control; #p < 0.05 versus LPS treatment; αp < 0.05 versus OGD/REOX.
Figure 9.
Figure 9.
Inhibition of NHE-1 activity reduces cytokine release from activated primary microglia. Release of innate immune cytokines was determined in primary microglia cells after either 24 h LPS treatment (500 ng/ml) or 24 h REOX after 2 h OGD. HOE 642 at 1 μm was present during 24 h LPS or REOX treatment. Released cytokines are expressed in picograms per milligrams. Data are mean ± SD. n = 3. *p < 0.05 versus normoxic control; #p < 0.05 versus LPS treatment; αp < 0.05 versus OGD/REOX.
Figure 10.
Figure 10.
Proposed mechanisms underlying NHE-1 in promotion of microglial activation. In response to ischemia or LPS, brain microglia are activated to produce a “respiratory burst,” which generates ROS, in particular O2· and peroxynitrite. During the respiratory burst, microglial NADPH oxidase, which converts the O2 into the O2·, expels electrons across the cell membrane and accumulates H+ inside microglia. Therefore, activation of microglia is associated with a large burst of intracellular H+ generation. The H+ extrusion mechanisms are then required to regulate the optimal pHi and limit depolarization of the microglia to maintain the activity of the NADPH oxidase. This task could be accomplished in part by NHE-1, H+ conductance, or a vacuolar H+-ATPase (the latter two not shown). NHE1-mediated [Na+]i overload and subsequent activation of NCXrev elevate [Ca2+]i and enhance the p38 mitogen-activated protein kinase- and/or NF-κB-mediated inflammatory responses that cause the death of target cells.

Similar articles

Cited by

References

    1. Bedard K, Krause KH. The NOX family of ROS-generating NADPH oxidases: physiology and pathophysiology. Physiol Rev. 2007;87:245–313. - PubMed
    1. Block ML, Hong JS. Chronic microglial activation and progressive dopaminergic neurotoxicity. Biochem Soc Trans. 2007;35:1127–1132. - PubMed
    1. Boscia F, Gala R, Pannaccione A, Secondo A, Scorziello A, Di Renzo G, Annunziato L. NCX1 expression and functional activity increase in microglia invading the infarct core. Stroke. 2009;40:3608–3617. - PubMed
    1. Boyarsky G, Ransom B, Schlue WR, Davis MB, Boron WF. Intracellular pH regulation in single cultured astrocytes from rat forebrain. Glia. 1993;8:241–248. - PubMed
    1. Brookes PS, Yoon Y, Robotham JL, Anders MW, Sheu SS. Calcium, ATP, and ROS: a mitochondrial love-hate triangle. Am J Physiol Cell Physiol. 2004;287:C817–C833. - PubMed

Publication types

MeSH terms

LinkOut - more resources