. 2010 Nov 10;30(45):15241-53.
doi: 10.1523/JNEUROSCI.2171-10.2010.

A neuronal population measure of attention predicts behavioral performance on individual trials

Affiliations

A neuronal population measure of attention predicts behavioral performance on individual trials

Marlene R Cohen et al. J Neurosci. .

Abstract

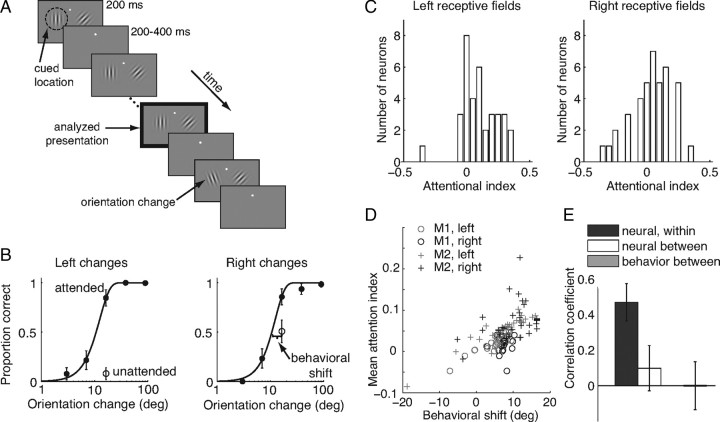
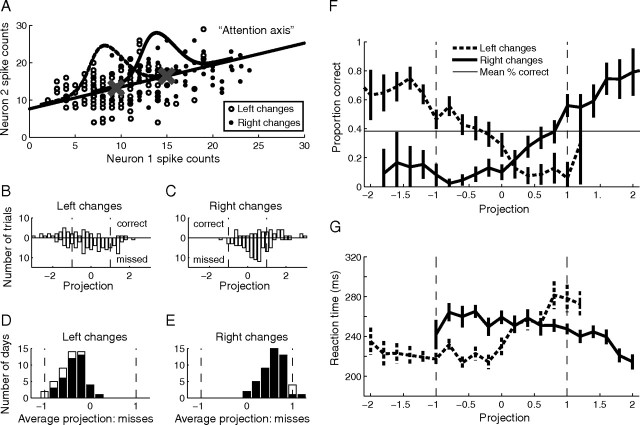
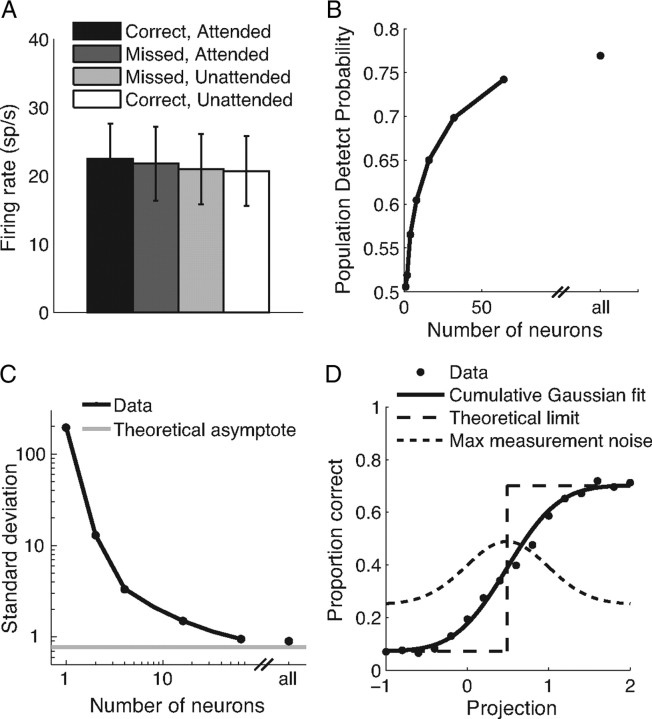
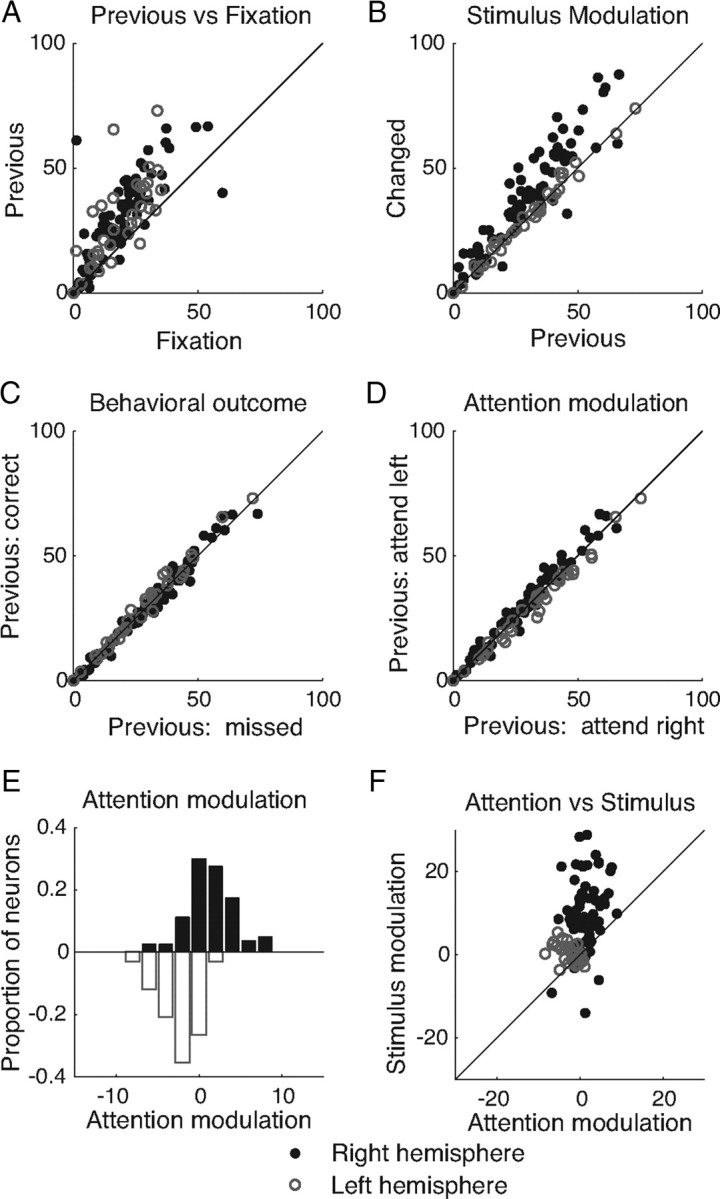
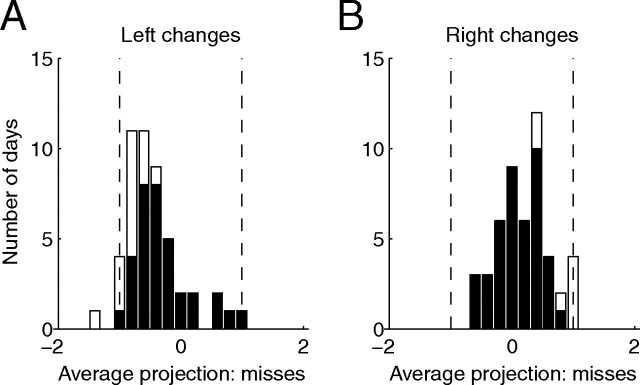
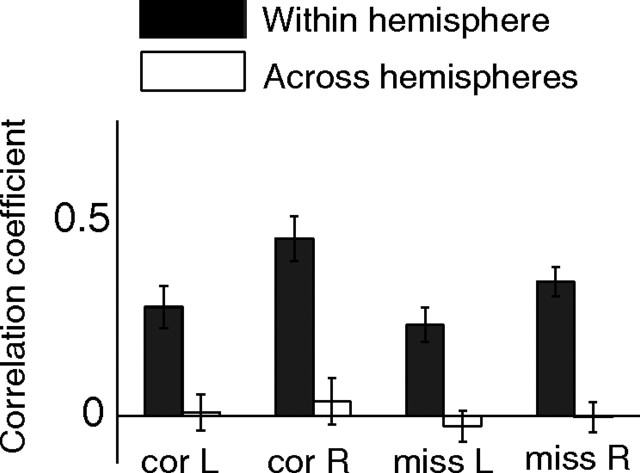
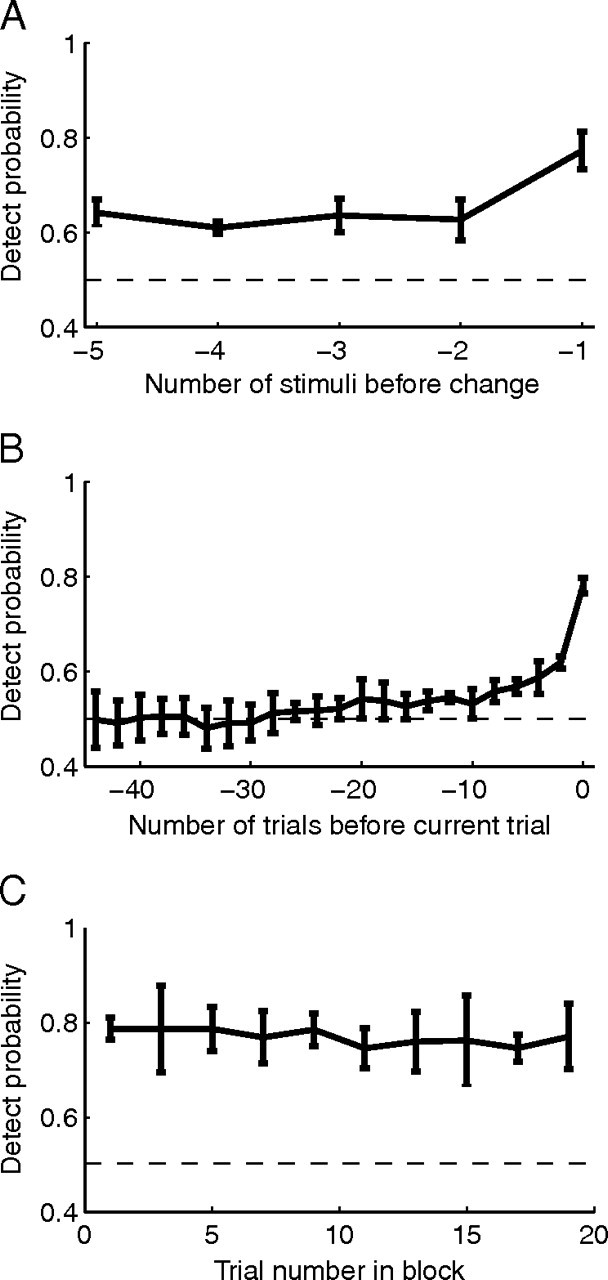
Visual attention improves perception for an attended location or feature and also modulates the responses of sensory neurons. In laboratory studies, the sensory stimuli and task instructions are held constant within an attentional condition, but despite experimenters' best efforts, attention likely varies from moment to moment. Because most previous studies have focused on single neurons, it has been impossible to use neuronal responses to identify attentional fluctuations and determine whether these are associated with changes in behavior. We show that an instantaneous measure of attention based on the responses of a modest number of neurons in area V4 of the rhesus monkey (Macaca mulatta) can reliably predict large changes in an animal's ability to perform a difficult psychophysical task. Unexpectedly, this measure shows that the amount of attention allocated at any moment to locations in opposite hemifields is uncorrelated, suggesting that animals allocate attention to each stimulus independently rather than moving their attentional focus from one location to another.


Figures

Figure 1.
Figure 1.
Over the course of a day, average attentional modulation of V4 neurons correlates with average improvement in behavior. A, Schematic of orientation change detection task. Two Gabor stimuli synchronously flashed on for 200 ms and off for a randomized 200–400 ms period. At an unsignaled time, the orientation of one of the stimuli changed and the monkey was rewarded for making a saccade to the stimulus that changed. Attention was cued in blocks, and the cue was valid on 80% of trials, meaning that on an “attend-left” block of trials (depicted here), 80% of orientation changes were to the left stimulus. The monkey was rewarded for correctly detecting any change, even on the unattended side. Unless otherwise stated, all analyses were performed on responses to the stimulus before the orientation change (black outlined panel). B, Psychometric performance from a typical example experiment on trials when the change occurred in the left stimulus (left) or right stimulus (right). Proportion correct is plotted as a function of orientation change in degrees (deg) for trials in which the change occurred at the attended (filled circles) or unattended (open circles) location. Unattended changes occurred only at the middle difficulty level. Error bars represent 95% confidence intervals (binomial statistics). Behavioral improvement was quantified as the lateral shift in degrees between the measured performance when the change occurred at the unattended location and the Weibull fit of performance at the attended location. C, Frequency histograms of attentional modulation indices of neurons from the example dataset whose receptive fields overlapped the left stimulus (left plot) or the right stimulus (right). Attentional modulation index was defined as the difference between the average response to the stimulus before correct detections at the attended location and the unattended location, divided by the sum. D, Average attentional modulation index as a function of behavioral shift (in degrees) for all 98 hemisphere days for each monkey (M1 and M2, circles and crosses, respectively) and receptive field location (gray, left; black, right). E, Correlation coefficients between attentional modulation indices for two randomly selected groups of neurons within a hemisphere (black bar), the full groups of neurons recorded in opposite hemispheres (white bar), and behavioral shift in the two hemifields (gray bar).
Figure 2.
Figure 2.
A single trial measure of attention based on population responses accurately predicts behavior. A, Procedure for calculating attentional allocation on a single trial. Analysis was restricted to a single difficult orientation change (4.7°) for which attentional cues were always valid. For each trial, the number of spikes fired by n simultaneously recorded neurons during the stimulus before an orientation change in the left hemifield (open circles) and right hemifield (filled circles) is plotted as a point in an n-dimensional space (a two-neuron example showing unusually large attention effects is plotted here). The attention axis (black line) is the line connecting the center of mass of the n-dimensional cloud of points for correct trials at each attention/change location (Xs). Each point (including missed trials) is projected onto the axis. The projections are scaled for each dataset so that a projection of −1 is equal to the mean response before correct left hemifield detections (left X), and +1 is the mean before correct right hemifield detections (right X). B, Frequency histogram of population projections on trials with left changes for the same example day before correct detections (upward bars) and missed changes (downward bars). Because of the way we normalized the distributions, the mean of the correct distribution is by definition −1. The mean of the missed distribution is shifted toward the mean of the opposite attentional location. C, Same as B, for changes in the right hemifield. D, Frequency histogram of average projection on missed changes in the left hemifield over all 49 d of data. Shaded bars indicate datasets for which the distribution of misses was shifted significantly toward the mean of the opposite attentional condition (t test, p < 0.05). E, Same as D, for right hemifield changes. F, Proportion correct detections as a function of population projection. For large negative projections, the proportion correct is high on left changes (dashed line) and low on right changes (solid line). For large positive projections, percentage correct is high on right changes and low on left changes. Error bars represent SEM. Points are plotted for bins that had ≥20 trials. G, Reaction time as a function of population projection. For large negative projections, reaction time is fast for left changes (dashed line) and slow for right changes (solid line). Conventions are as in F.
Figure 3.
Figure 3.
Moderate neuronal populations are necessary for precise estimates of attention. A, Mean firing rate responses to the stimulus before the orientation change for each individual neuron (single and multiunits) in each combination of attentional condition and behavioral outcome. Error bars represent average SD of firing rates for individual neurons. The variability of individual neurons makes it impractical to use their responses to reliably predict attentional state and behavioral outcome on individual trials. B, Population DPAA as a function of the number of neurons used to calculate population projections. The point at the right represents mean population DPAA using projections based on all simultaneously recorded neurons for each dataset (mean, 79 neurons). C, Standard deviation of the distribution of population projections as a function of the number of neurons used to calculate the projection. At asymptote, this measure represents actual variability in attention rather than measurement noise. The gray line represents the theoretical asymptote (using the procedure depicted in D). Axes are plotted on a log scale to illustrate the dramatic reduction in SD that comes from adding even a few neurons to small population sizes (left side of the plot). Other conventions are as in B. D, Procedure for determining the amount of variability along the attention axis that could be caused by measurement noise. To test the hypothesis that all of the observed variance in the distribution of projections along the attention axis is caused by measurement noise, we assumed that attentional state is binary and that performance is at a fixed level for a given attentional state (a step function, dashed line). We fit the function relating proportion correct to attention axis projection with a cumulative Gaussian with fitted bounds (solid line; mean 0.45, SD 0.47, lower bound 0.07, upper bound 0.70). This fitted Gaussian (dotted line; height of the Gaussian is arbitrary) places an upper bound on the amount of variance that can be caused by measurement noise (fitted variance = 0.22), leaving a minimum variance of 0.59 (SD = 0.77) to be explained by true variability along the attention axis. This theoretical asymptote of variance in attentional state that cannot be explained by measurement noise is the gray line plotted in C.
Figure 4.
Figure 4.
Modulation of the mean responses of individual neurons. A, Mean responses (in sp/s) of all simultaneously recorded neurons from an example dataset on trials in which a 4.7° change occurred in the stimulus in the left hemifield (validly cued trials only) during the stimulus immediately preceding the change (previous) as function of responses during the initial fixation period at the start of the trial (fixation). The responses of neurons in the left hemisphere (whose receptive fields do not overlap the attended stimulus) are represented with open circles, and responses of neurons in the right hemispheres are represented with filled circles. B, Mean responses to the changed stimulus as a function of responses to the previous stimulus. Trials and conventions are as in A. C, Responses to the previous stimulus as a function of behavioral outcome. Trials and conventions are as in A. D, Mean responses to the previous stimulus as a function of attention condition. The x-axis is as in B. The y-axis represents mean responses on trials with a 4.7° change in the right hemisphere (validly cued trials only). Plotting conventions are as in A. E, Frequency histogram of attention modulation (mean response to the previous stimulus on attend left minus attend right trials) for neurons in the right (top) and left (bottom) hemispheres. This mean attention modulation is used to construct the attention axis. F, Stimulus modulation (mean response to the changed minus the previous stimulus) as a function of attention modulation (same x-axis as in E).
Figure 5.
Figure 5.
Variability in attention, not bottom-up responses, is correlated with behavior. A, Average projection of population responses to the stimulus preceding a missed orientation change in the left hemifield for subpopulations of neurons whose attentional indices and stimulus tuning indices are of the opposite sign. The mean of the distribution is shifted toward the mean of the opposite attentional condition, suggesting that missed changes result from improperly allocated attention (see Results). Conventions are as in Figure 2, D and E. B, Same as A for changes in the right hemifield.
Figure 6.
Figure 6.
Fluctuations in attention allocated to the two hemispheres are independent. Correlation coefficient between population projections of randomly chosen subsets of neurons within a hemisphere (black bars) and all neurons across hemispheres (white bars) for the four combinations of attention conditions and trial outcomes. For all four combinations, the correlation coefficient was statistically greater than zero for the same hemisphere projections and indistinguishable from zero (p > 0.5) for opposite hemisphere projections. R, Right; L, left; cor, correct detections; miss, missed changes.
Figure 7.
Figure 7.
Dynamics of attention. A, Population DPAA as a function of number of stimuli before the change. Error bars represent SEM. B, Same as in A, as a function of number of trials before the current trial (based on the stimulus before the change in each trial). C, Population DPAA as a function of trial number within an attentional block.

Similar articles

Cited by

References

    1. Alvarez GA, Cavanagh P. Independent resources for attentional tracking in the left and right visual hemifields. Psychol Sci. 2005;16:637–643. - PubMed
    1. Assad JA. Neural coding of behavioral relevance in parietal cortex. Curr Opin Neurobiol. 2003;13:194–197. - PubMed
    1. Barberini CL, Cohen MR, Wandell BA, Newsome WT. Cone signal interactions in direction-selective neurons in the middle temporal visual area (MT) J Vis. 2005;5:603–621. - PubMed
    1. Boudreau CE, Williford TH, Maunsell JHR. Effects of task difficulty and target likelihood in area V4 of macaque monkeys. J Neurophysiol. 2006;96:2377–2387. - PubMed
    1. Boynton GM. A framework for describing the effects of attention on visual responses. Vision Res. 2009;49:1129–1143. - PMC - PubMed

Publication types

LinkOut - more resources