. 2010 Nov 10;30(45):15277-85.
doi: 10.1523/JNEUROSCI.2331-10.2010.

Gap junction expression is required for normal chemical synapse formation

Affiliations

Gap junction expression is required for normal chemical synapse formation

Krista L Todd et al. J Neurosci. .

Abstract

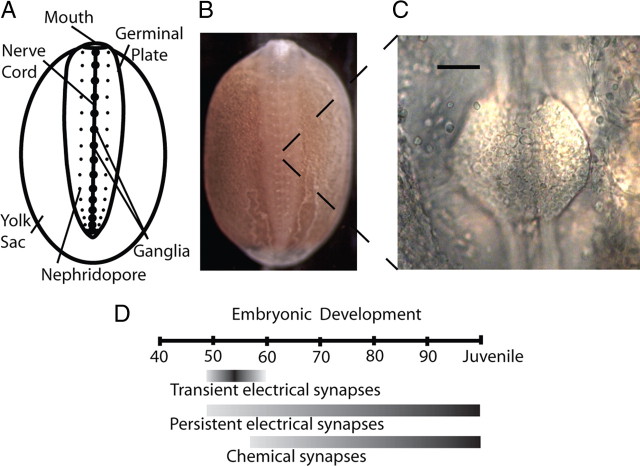
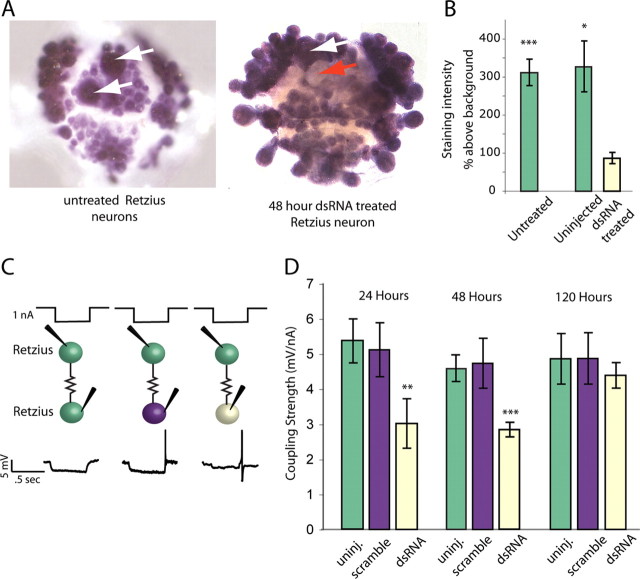
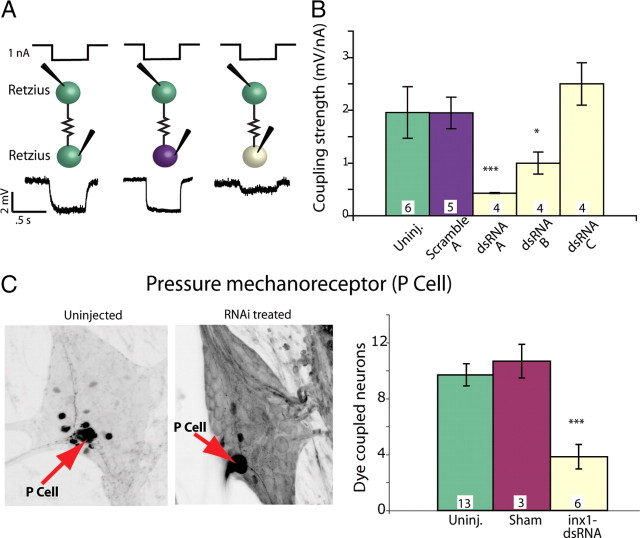
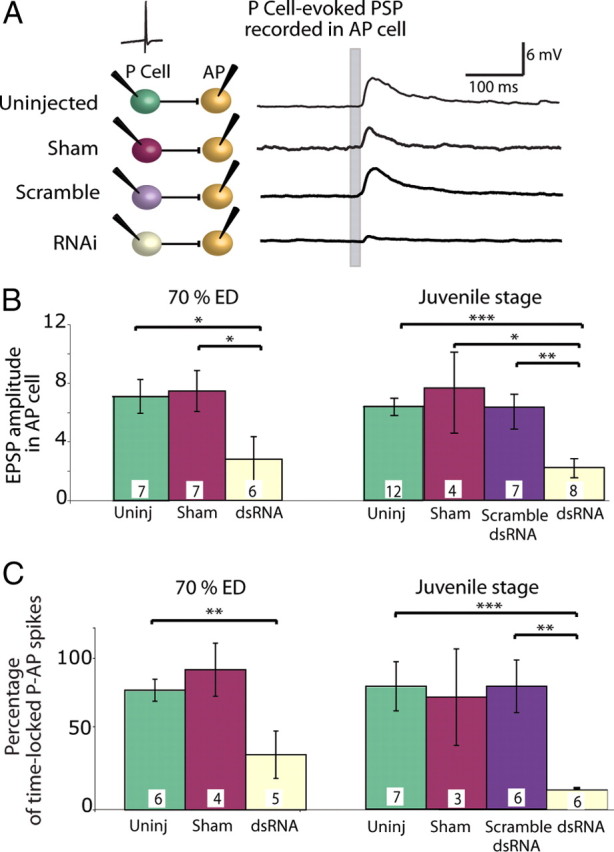
Electrical and chemical synapses provide two distinct modes of direct communication between neurons, and the embryonic development of the two is typically not simultaneous. Instead, in both vertebrates and invertebrates, gap junction-based electrical synapses arise before chemical synaptogenesis, and the early circuits composed of gap junction-based electrical synapses resemble those produced later by chemical synapses. This developmental sequence from electrical to chemical synapses has led to the hypothesis that, in developing neuronal circuits, electrical junctions are necessary forerunners of chemical synapses. Up to now, it has been difficult to test this hypothesis directly, but we can identify individual neurons in the leech nervous system from before the time when synapses are first forming, so we could test the hypothesis. Using RNA interference, we transiently reduced gap junction expression in individual identified neurons during the 2-4 d when chemical synapses normally form. We found that the expected chemical synapses failed to form on schedule, and they were still missing months later when the nervous system was fully mature. We conclude that the formation of gap junctions between leech neurons is a necessary step in the formation of chemical synaptic junctions, confirming the predicted relation between electrical synapses and chemical synaptogenesis.


Figures

Figure 1.
Figure 1.
Hirudo verbana anatomy and timeline of synaptic development. A, Anatomy of a leech embryo at ∼50% of embryonic development (50% ED), the stage at which we injected dsRNA into neurons. The germinal plate develops on top of a yolk-filled sac; the embryo grows toward the posterior and expands left and right until it encircles the yolk sac. B, Leech embryo at ∼50% ED, the stage depicted in A. The nerve cord is visible on the midline through the transparent body wall of the animal. This embryo is ∼6 mm long. C, The ventral surface of a segmental ganglion, viewed through a small incision in the body wall. Somata of ∼200 neurons are visible in this ganglion. Scale bar, 50 μm. D, Timeline for development of electrical and chemical synapses in Hirudo (modified from Marin-Burgin et al., 2005). Neurons lack processes before ∼40% ED, and the leech becomes a juvenile at 100% ED. One day equals ∼3% ED at room temperature (Reynolds et al., 1998).
Figure 2.
Figure 2.
RNA interference decreased Hm–inx1 mRNA and coupling strength. A, In situ hybridization using full-length Hm–inx1 probe and an adult leech ganglion produced dark staining (left) in all neurons, including untreated Retzius cells (white arrows), indicating high levels of Hm–inx1 mRNA in all neurons. mRNA levels decreased 48 h after dsRNA was injected into only one Retzius cell (red arrow), whereas the second, uninjected neuron stained darkly (white arrow). B, Uninjected adult Retzius cells (in ganglia in which the second Retzius cell received an injection of dsRNA) and those in untreated ganglia stained more darkly than Retzius cells injected with Hm–inx1 dsRNA 48 h before staining (n = 8 untreated, 4 uninjected, and 4 RNAi treated; error bars show SEM; *p < 0.05, ***p < 0.001). C, Current and voltage traces of Retzius-to-Retzius electrical coupling. Half-second steps of hyperpolarizing current were passed into one Retzius cell (top of C), and a voltage deflection was recorded in the other Retzius cell (bottom of C). Green indicates an uninjected Retzius cell, purple a Retzius cell injected with scrambled dsRNA, and pale yellow a Retzius injected with dsRNA targeting Hm–inx1. Coupling strength was the slope of the line fitted to a plot of voltage change in the second cell as a function of the amount of current passed into the first cell. D, Coupling strength in neurons was lower than normal at 24 and 48 h after dsRNA injection, and it returned to normal values by 120 h after the treatment. (24 h, n = 10 uninjected, 6 scramble injected, and 10 RNAi treated; 48 h, n = 22 uninjected, 12 scramble injected, and 20 RNAi treated; 120 h, n = 7 uninjected, 7 scramble injected, and 6 RNAi; Error bars show SEM; **p < 0.01, ***p < 0.001). Color code is the same as in C.
Figure 3.
Figure 3.
dsRNA targeting Hm–inx1 decreased function in embryonic electrical synapses. A, Current and voltage traces of embryonic Retzius-to-Retzius electrical coupling. One nanoampere of hyperpolarizing current was passed into one Retzius cell for 0.5 s, and a voltage deflection was recorded in the other Retzius cell. Green indicates an uninjected Retzius cell, purple a Retzius cell injected with scrambled dsRNA, and pale yellow a Retzius injected with active dsRNA. Injections were made at 60% ED, and the recordings were performed 48 h later, at 66% ED. B, Different dsRNA sequences produced different effects on electrical coupling. Sequences arbitrarily called dsRNAi A and dsRNAi B significantly decreased electrical coupling strength 48 h after treatment (numbers within each bar in B and C indicate the number of preparations of each type; ANOVA, *p < 0.05, ***p < 0.001; significance is compared with both uninjected and scramble-injected preparations). C, In each ganglion, a single mechanosensory P cell (red arrows) was injected with Neurobiotin; dark cells are neurons dye coupled to the Neurobiotin-injected P cell. The left image shows an untreated P cell; the right image shows cells dye coupled to the P cell 48 h after it was treated with inx1–dsRNA. The number of cells dye coupled to the P cell was significantly lower than control values for inx1–dsRNA-treated cells assayed 48 h after treatment (ANOVA, p < 0.001).
Figure 4.
Figure 4.
Blocking electrical synapses in embryos perturbed chemical synaptogenesis. A, EPSPs in an AP cell in response to single spikes in a P cell within the same ganglion; the P cell spike occurred at the time marked by the gray bar on the AP recordings. AP cells were held hyperpolarized to silence their tonic firing. Each recording shown is from a single trial. Colors in the diagram are matched to the bars in B and C. B, EPSP amplitudes recorded in AP cells in response to P cell action potentials. When a P cell was treated with dsRNA before the onset of chemical synaptogenesis, it produced much smaller EPSPs in AP cells both 1 week after treatment (70% ED) and 3–5 weeks after treatment (juvenile stage) (ANOVA, *p < 0.05, **p < 0.01, ***p < 0.001). C, Probability of AP cell spikes in response to a spike in a P cell. Untreated, sham-treated, and scrambled dsRNA-injected P cells elicited a time-locked action potential in the AP cell ∼80% of the time. Treating the P cell with dsRNA greatly reduced the incidence of time-locked action potentials in AP cells both at 70% ED and in the juvenile stage (ANOVA, **p < 0.01, ***p < 0.001). Numbers within each bar in B and C indicate the number of preparations of each type.
Figure 5.
Figure 5.
The electrical synapse between the P and AP cells returned to normal after RNAi. A, Strength of the electrical synapse and dye coupling between the P cell and the AP cell in untreated ganglia. In black, the coupling strength between P and AP was strong early in development and waned but persisted at a lower level into adulthood. In gray, the number of neurons that were dye coupled to P cells increased to a steady state at the juvenile stage. B, The number of neurons dye coupled to P cells injected with dsRNA returned to normal by 70% ED, i.e., 1 week after treatment, and persisted in juveniles. Green bars indicate the number of somata dye coupled to uninjected P cells, red to sham-injected P cells (injected with the vehicle Alexa Fluor 488), and pale yellow to P cells injected with inx1–dsRNA. C, Electrical coupling strength between the P cell and the AP cell returned to the normal range 1 week after treatment and persisted into the juvenile stage. Green bars indicate the coupling strength from an uninjected P cell to the AP cell, red indicates sham-injected P cells (injected with the vehicle containing Alexa Fluor 488), purple indicates scrambled dsRNA-injected P cells, and pale yellow indicates P cells injected with inx1–dsRNA.
Figure 6.
Figure 6.
Stimulating dsRNA-treated P cells failed to elicit a behavioral response. A, Seven-segment-long piece of body wall in which only the segment containing the treated P cell remained innervated (area between the dashed lines). We applied a tactile stimulus within the receptive field of the Pd (dorsal, yellow oval) or Pv (ventral, white oval). B, Maximal longitudinal contraction after a stimulus in the receptive field of a Pd neuron. Using an optic flow algorithm (Baca et al., 2005), digital movies of contractions were converted to color-coded vector maps. Stimuli occurred at the asterisks; red indicates motion downward toward the point of touch, and blue indicates motion upward toward the touch. In both uninjected and scramble-injected controls, longitudinal movement is centered on the asterisk, indicating that the longitudinal contraction was focused on the stimulus. Colored rectangles below each image indicate the quadrant of the body wall innervated by each P cell: Pd indicates a dorsal quadrant, and Pv indicates a ventral quadrant on each side. C, Longitudinal displacement in body-wall preparations after three different treatments: uninjected (green line), Pd injected with scrambled dsRNA (purple line), and Pd injected with inx1–dsRNA (pale yellow line). Amplitudes of movements within the region of interest (ROI), normalized to the anteroposterior dimension of an annulus, were integrated to yield a local bend profile (Baca et al., 2005). D, Maximum displacement of the body-wall region of interest within the stimulated dorsal quadrant (contraction strength) as force increased (ANOVA with Bonferroni's post hoc analysis, *p < 0.05, ***p < 0.001). E, Ventral local bends in response to stimulating the receptive field of a Pv. Colors (which indicate how the ipsilateral Pd in the ganglion was treated) are the same as in D; yellow bars show results of ventral stimulation in segments in which a Pd cell was injected with im1–dsRNA (ANOVA with Bonferroni's post hoc analysis, *p < 0.05, ***p < 0.001).
Figure 7.
Figure 7.
Treated P cells received and encoded sensory input normally. A, The hole-in-the-wall preparation showing the one functionally innervated segment in a five-segment section of leech body wall. An incision was made along the dorsal midline, the piece of body wall was pinned flat, and the hole over the ganglion was enlarged and held open by pins. The receptive fields of the two Pd cells are indicated (red boxes). B, Intracellular recordings from Pd cells in response to a brief (∼500 ms) 30 mN stimulus in the receptive fields of the cell. “Contra” refers to the untreated Pd cell located on the side of the ganglion opposite to the inx1–dsRNA-treated Pd cell. C, Number of spikes in a 500 ms time window after stimulation; the number of spikes elicited in an inx1–dsRNA-treated Pd cell was indistinguishable from controls. Color code as in Figures 4 and 5.

Similar articles

Cited by

References

    1. Baca SM, Thomson EE, Kristan WB., Jr Location and intensity discrimination in the leech local bend response quantified using optic flow and principal components analysis. J Neurophysiol. 2005;93:3560–3572. - PubMed
    1. Baca SM, Marin-Burgin A, Wagenaar DA, Kristan WB., Jr Widespread inhibition proportional to excitation controls the gain of a leech behavioral circuit. Neuron. 2008;57:276–289. - PMC - PubMed
    1. Bani-Yaghoub M, Underhill TM, Naus CC. Gap junction blockage interferes with neuronal and astroglial differentiation of mouse P19 embryonal carcinoma cells. Dev Genet. 1999a;24:69–81. - PubMed
    1. Bani-Yaghoub M, Bechberger JF, Underhill TM, Naus CC. The effects of gap junction blockage on neuronal differentiation of human NTera2/clone D1 cells. Exp Neurol. 1999b;156:16–32. - PubMed
    1. Bennett MV. Physiology of electrotonic junctions. Ann NY Acad Sci. 1966;137:509–539. - PubMed

Publication types

LinkOut - more resources