. 2010 Nov 10;30(45):15317-29.
doi: 10.1523/JNEUROSCI.1821-10.2010.

Flotillin-mediated endocytic events dictate cell type-specific responses to semaphorin 3A

Affiliations

Flotillin-mediated endocytic events dictate cell type-specific responses to semaphorin 3A

Ioana Carcea et al. J Neurosci. .

Abstract

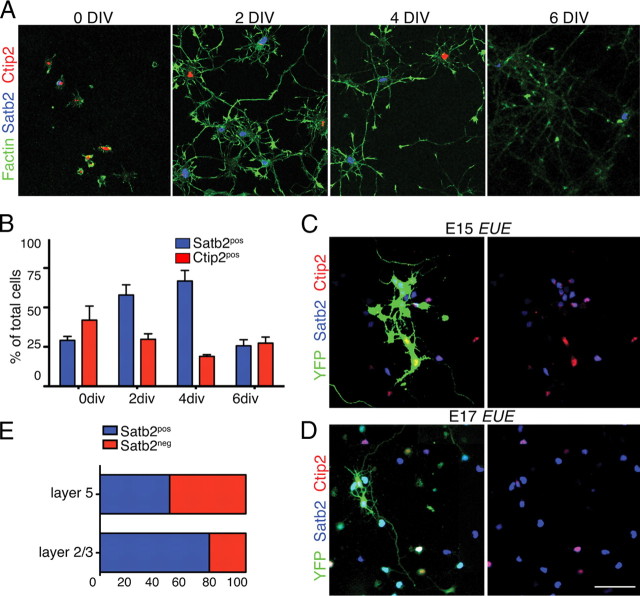
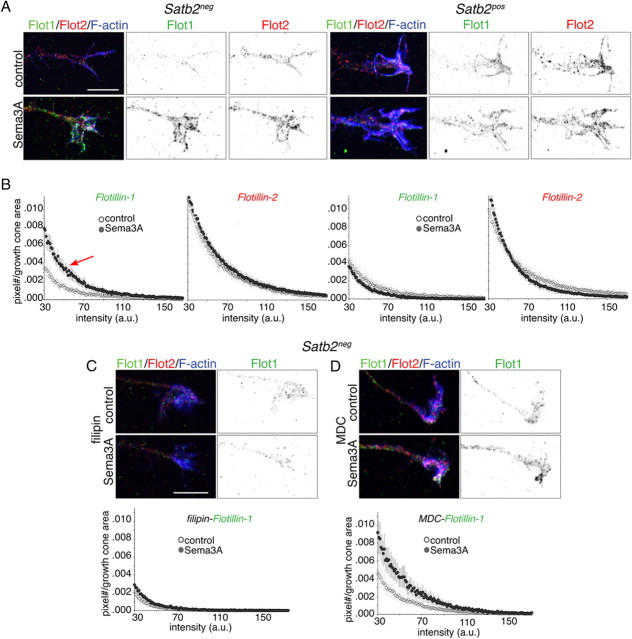
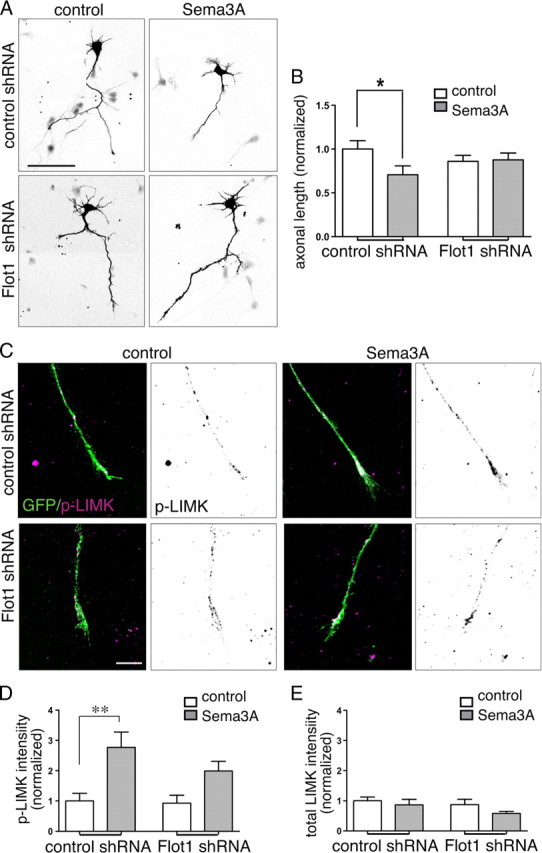
Cortical efferents growing in the same environment diverge early in development. The expression of particular transcription factors dictates the trajectories taken, presumably by regulating responsiveness to guidance cues via cellular mechanisms that are not yet known. Here, we show that cortical neurons that are dissociated and grown in culture maintain their cell type-specific identities defined by the expression of transcription factors. Using this model system, we sought to identify and characterize mechanisms that are recruited to produce cell type-specific responses to Semaphorin 3A (Sema3A), a guidance cue that would be presented similarly to cortical axons in vivo. Axons from presumptive corticofugal neurons lacking the transcription factor Satb2 and expressing Ctip2 or Tbr1 respond far more robustly to Sema3A than those from presumptive callosal neurons expressing Satb2. Both populations of axons express similar levels of Sema3A receptors (neuropilin-1, cell adhesion molecule L1, and plexinA4), but significantly, axons from neurons lacking Satb2 internalize more Sema3A, and they do so via a raft-mediated endocytic pathway. We used an in silico approach to identify the endocytosis effector flotillin-1 as a Sema3A signaling candidate. We tested the contributions of flotillin-1 to Sema3A endocytosis and signaling, and show that raft-mediated Sema3A endocytosis is defined by and depends on the recruitment of flotillin-1, which mediates LIM domain kinase activation and regulates axon responsiveness to Sema3A in presumptive corticofugal axons.


Figures

Figure 1.
Figure 1.
Cortical neurons maintain their identity in dissociated cultures. A, Confocal images of cortical neurons grown in culture, fixed at 0, 2, 4, or 6 DIV and then immunostained for Satb2 (blue) and Ctip2 (red). Phalloidin staining shows actin filaments in green. Very few neurons expressing Satb2 have detectable levels of Ctip2 labeling. B, Bar graph plots the percentage of neurons positive for Satb2 (blue) or Ctip2 (red). Between 2 and 4 DIV, ∼25% are not labeled by either Satb2 or Ctip2. Error bars represent SEM (n = 3 experiments). C, D, Confocal images of cultured cortical neurons in which populations of deep (C) or superficial layer neurons (D) were labeled by EUE of a YFP expression vector at either E15 or E17, respectively. Neurons were immunostained for Satb2 (blue), Ctip2 (red) and YFP (green). E, Equal proportions of E15 electroporated neurons label for Satb2 or Ctip2, with little overlap. About 80% of E17 electroporated neurons are labeled for Satb2. Scale bars: A, 100 μm; (in D) C, D, 50 μm.
Figure 2.
Figure 2.
Sema3A triggers distinct responses in two populations of cortical neurons. A, Inverted fluorescence microscope images of E15 neurons expressing YFP and grown in either control or Sema3A media, and then fixed and labeled for Satb2 (data not shown). Axons from Sema3A-exposed Satb2neg neurons are notably shorter. Scale bar, 100 μm. B, Axonal length measurements from neurons treated as in A were normalized to the mean values of Satb2neg controls. Satb2neg neurons display significant axon growth inhibition (n = 26 axons; t test, p = 0.035), while axons of Satb2pos neurons have similar lengths in control and Sema3A conditions (n = 29 axons; t test, p = 0.6; *significant difference). C, Differential interference contrast images are representative snapshots of the same axonal growth cones taken after 30 min in control media (t = 0) and after 30 min in Sema3A. After imaging, neurons were fixed and immunolabeled for Satb2 (data not shown). Quantitative analysis showed that 78.75 ± 12.46% of Satb2neg axonal growth cones collapse in response to Sema3A, whereas only 37.03 ± 8.06% of growth cones from Satb2pos neurons collapse (n > 35 growth cones per group; t test, *p = 0.015). Scale bar, 10 μm. D, Confocal images show GFP-labeled neurons plated on stripes of Sema3A (red) alternating with stripes of control Fc (black), and then fixed and immunostained for Satb2 (data not shown). Axons of Satb2neg neurons (left) avoid Sema3A stripes, whereas axons of Satb2pos neurons appear to ignore the borders between Sema3A and control Fc stripes. The examples shown display stripes of different widths, but results were similar with wide or thin stripes. Magnification as in A. E, As in D, with neurons transfected with Ctip2 or control (pcDNA3.1). F, Results from multiple stripe experiments were quantified as the number of border crossings per axon, normalized to the values for Satb2pos axons (D: n = 50 axons; t test, *p = 0.01) or for control, pcDNA3.1 expressing axons (E: n = 47 axons; t test, **p = 0.003). Error bars represent SEM.
Figure 3.
Figure 3.
Subunits of the Sema3A receptor complex are expressed at similar levels in cortical axonal growth cones. A–E, Confocal images showing immunolabeling for total levels of Npn1 (A), PlxA4 (B), L1CAM (C), and for surface levels of Npn1 (D) and L1CAM (E) in axonal growth cones from Satb2neg and Satb2pos neurons (nuclear Satb2 staining not shown). Top panels of each group show immunostaining in green as an overlay with F-actin in purple to demarcate growth cone. Bottom panels show an inverted black-and-white view of the immunolabeling only. Scale bar, 5 μm.
Figure 4.
Figure 4.
Sema3A internalization is distinct between deep and superficial layer neurons. A–F, Images show internalized Sema3A-Qdots (black) in masks of growth cones defined by YFP expression in neurons labeled by EUE (green). The top row (A, C, E) are growth cones from E15-born neurons and the bottom row, from E17-born neurons. Treatment conditions are indicated at the top of each column. Sema3A internalized/growth cone area by E15 EUE neurons (A) is greater than in growth cones of E17 EUE neurons (B) and prevented by filipin treatment. Scale bar: A (for A–F), 10 μm. G, Bar graph compares internalization following MDC (dotted bars) and filipin (hatched bars) in E15- and E17-born neurons. E15-born neurons internalize significantly more Sema3A. For E15-born neurons, filipin significantly reduces internalization (one-way ANOVA, p = 0.02; n = 27 growth cones from 3 experiments). For E17-born neurons, both MDC and filipin significantly reduce internalization (one-way ANOVA, p = 0.002; n = 25 growth cones from 3 experiments). Bonferroni's multiple-comparison test was used to identify the sources of significant differences (*). H, Images of growth cone masks based on phalloidin-staining (blue) and surface bound Sema3A-Qdots (black) in Satb2neg and Satb2pos neurons. I, Bar graph shows that filipin treatment prevents growth cone collapse in response to Sema3A (one-way ANOVA, p = 0.001; n = 4 experiments; *significant difference in Bonferroni's post-test). J, Bar graph shows that MDC does not increase the collapse of growth cones in Satb2pos neurons exposed to Sema3A (n = 3 experiments; t test, p > 0.05; one-way ANOVA showed no differences between control and MDC groups). Error bars represent SEM.
Figure 5.
Figure 5.
Flotillin-1 and -2 are novel candidates downstream of Sema3A and are immunodetected in cortical axons in vivo and in vitro. A, In silico built network of Sema3A seed list (red) and novel candidate genes with high z-score (yellow) or lower z-score (blue). Flotillin-1 and -2 are magnified on the left. B–E, Confocal images of immunohistochemiical staining for flotillin-1 (B, C) and -2 (D, E) in E14.5 mouse cerebral cortex. Flotillins (green) are detected in phalloidin-labeled tracts and processes (in purple, red arrows) in the intermediate zone (IZ) and the internal capsule (IC). Boxed regions in A and D are shown in inverted black-and-white images in C and E. Scale bars: B, D, 200 μm; C, E, 100 μm. F, G, Confocal images of dissociated cortical neurons. Flotillin-1 (F), and -2 (G) (both green and black in adjacent, inverse image) are detected in small puncta in the filopodia and lamellipodia of axonal growth cones (delineated by F-actin labeling shown in purple) as well as axonal shafts. Scale bars, 5 μm.
Figure 6.
Figure 6.
Sema3A increases flotillin-1 clustering in growth cones of Satb2neg but not Satb2pos neurons. A, Confocal images of axonal growth cones from Satb2neg and Satb2pos neurons treated with control media or Sema3A and immunolabeled for flotillin-1 (green in overlay and black in adjacent, inverse image) and flotillin-2 (red in overlay and black in adjacent, inverse image) and stained with phalloidin (F-actin; blue). B, Histograms plot flotillin labeling/growth cone area relative to intensity for control (white circles) and Sema3A exposure (black circles). To reduce artifact, data acquisition was limited to intensities >30 arbitrary units (a.u.) and to better illustrate the relevant changes in the histogram, the upper limit was reduced to 170 a.u. (from 250 a.u.). In growth cones of Satb2neg neurons (left two graphs), the mean intensity of flotillin-1 clusters increases after stimulation with Sema3A (red arrow) (n = 25 growth cones from 3 experiments; p < 0.01, two-way ANOVA). Flotillin-2 clustering does not significantly change under the same conditions (p > 0.05). In growth cones of Satb2pos neurons (right two graphs), neither flotillin-1 nor -2 labeling changes after Sema3A exposure (n = 18 growth cones from 3 experiments; p > 0.05, two-way ANOVA). C, In growth cones of Satb2neg neurons treated with filipin, confocal images and analysis (as in A, B) show that the mean intensity of flotillin-1 clusters is similar between control and Sema3A-treated neurons (n = 20 growth cones from 2 experiments; p > 0.05, two-way ANOVA). D, In growth cones of Satb2neg neurons treated with MDC, Sema3A is still capable of increasing the intensity/number of flotillin-1 puncta compared with control media (n = 17 growth cones from 2 experiments; p < 0.05, two-way ANOVA). Scale bar: A (for A, C, D), 10 μm.
Figure 7.
Figure 7.
Flotillin-1 is required for the dynamin-independent, ERM-dependent endocytosis of Sema3A. A, Images show that flotillin knockdown reduces the amount of internalized Sema3A (in black) compared with growth cones expressing control shRNAs. Growth cone boundaries are delineated by masks (green). Addition of dynasore 5 min before and during incubation with Sema3A appears to modestly decrease uptake, but flotillin shRNA more dramatically decreases Sema3A endocytosis. B, Bar graph compares mean area internalized Sema3A per growth cone area, normalized to controls (n = 34 growth cones from 2 experiments, p = 0.0058, one-way ANOVA; *p < 0.05 in a Bonferroni post-test). C, NEz inhibits Sema3A internalization and flotillin knockdown does not add significantly to this effect. D, Bar graph as in B (n = 34 growth cones from 2 experiments; p = 0.0031, one-way ANOVA; *p < 0.05 in a Bonferroni post-test). Scale bar: A (for A, C), 10 μm. Error bars represent SEM.
Figure 8.
Figure 8.
Flotillin-1 knockdown decreases Sema3A-mediated axon responses and LIMK activation. A, Inverted fluorescence microscope images of Satb2neg neurons (Satb2 labeling not shown) transfected with either control or Flot1 shRNAs and grown in control or Sema3A media for 72 h. Scale bar, 80 μm. B, Quantitative comparison of total axon length normalized to control data (tracings of 25 neurons transfected with control shRNA (*p = 0.0475, t test) and 32 neurons transfected with Flot1 shRNA mix (p = 0.8673, t test). C, D, Sema3A stimulation results in a nearly threefold increase in the levels of detectable T508-phosphorylated LIMK1 (purple) in Satb2neg growth cones expressing a control shRNA. Scale bar, 10 μm. In growth cones expressing flotillin-1 shRNAs, the increase is attenuated and not significant (n = 36 growth cones from 2 experiments; **p = 0.0022, one-way ANOVA and Bonferroni post-test). E, The levels of total LIMK do not change significantly (p = 0.4). Error bars represent SEM.
Figure 9.
Figure 9.
Model for the role of RME in the response of corticofugal axons to Sema3A. Sema3A stimulation triggers the recruitment of its receptors to lipid rafts (Guirland et al., 2004) and their consequent internalization in flotillin-1-positive endosomes. This step leads to the activation of LIMK, which inactivates cofilin-1. Cofilin-1 regulation of the actin cytoskeleton stimulates CME of adhesion sites (Chao and Kunz, 2009), allowing the detachment and retraction of the growth cone.

Similar articles

Cited by

References

    1. Aizawa H, Wakatsuki S, Ishii A, Moriyama K, Sasaki Y, Ohashi K, Sekine-Aizawa Y, Sehara-Fujisawa A, Mizuno K, Goshima Y, Yahara I. Phosphorylation of cofilin by LIM-kinase is necessary for semaphorin 3A-induced growth cone collapse. Nat Neurosci. 2001;4:367–373. - PubMed
    1. Alcamo EA, Chirivella L, Dautzenberg M, Dobreva G, Fariñas I, Grosschedl R, McConnell SK. Satb2 regulates callosal projection neuron identity in the developing cerebral cortex. Neuron. 2008;57:364–377. - PubMed
    1. Algrain M, Turunen O, Vaheri A, Louvard D, Arpin M. Ezrin contains cytoskeleton and membrane binding domains accounting for its proposed role as a membrane-cytoskeletal linker. J Cell Biol. 1993;120:129–139. - PMC - PubMed
    1. Arlotta P, Molyneaux BJ, Chen J, Inoue J, Kominami R, Macklis JD. Neuronal subtype-specific genes that control corticospinal motor neuron development in vivo. Neuron. 2005;45:207–221. - PubMed
    1. Bagnard D, Lohrum M, Uziel D, Püschel AW, Bolz J. Semaphorins act as attractive and repulsive guidance signals during the development of cortical projections. Development. 1998;125:5043–5053. - PubMed

Publication types

MeSH terms

LinkOut - more resources