. 2010 Nov 30;107(48):20691-6.
doi: 10.1073/pnas.1011365107. Epub 2010 Nov 10.

Measurement of adherent cell mass and growth

Affiliations

Measurement of adherent cell mass and growth

Kidong Park et al. Proc Natl Acad Sci U S A. .

Abstract

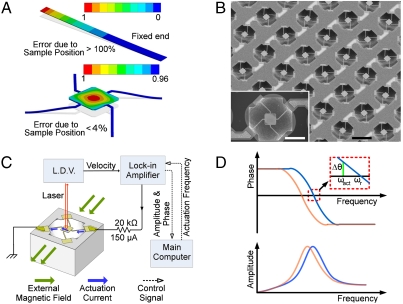
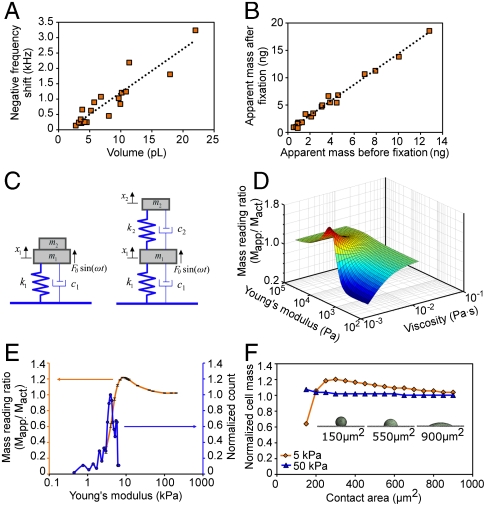
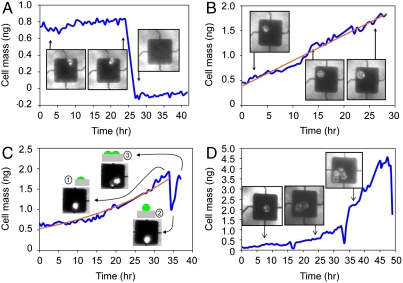
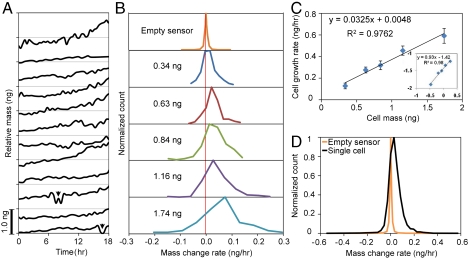
The characterization of physical properties of cells such as their mass and stiffness has been of great interest and can have profound implications in cell biology, tissue engineering, cancer, and disease research. For example, the direct dependence of cell growth rate on cell mass for individual adherent human cells can elucidate the mechanisms underlying cell cycle progression. Here we develop an array of micro-electro-mechanical systems (MEMS) resonant mass sensors that can be used to directly measure the biophysical properties, mass, and growth rate of single adherent cells. Unlike conventional cantilever mass sensors, our sensors retain a uniform mass sensitivity over the cell attachment surface. By measuring the frequency shift of the mass sensors with growing (soft) cells and fixed (stiff) cells, and through analytical modeling, we derive the Young's modulus of the unfixed cell and unravel the dependence of the cell mass measurement on cell stiffness. Finally, we grew individual cells on the mass sensors and measured their mass for 50+ hours. Our results demonstrate that adherent human colon epithelial cells have increased growth rates with a larger cell mass, and the average growth rate increases linearly with the cell mass, at 3.25%/hr. Our sensitive mass sensors with a position-independent mass sensitivity can be coupled with microscopy for simultaneous monitoring of cell growth and status, and provide an ideal method to study cell growth, cell cycle progression, differentiation, and apoptosis.


Conflict of interest statement

The authors declare no conflict of interest.

Figures

Fig. 1.
Fig. 1.
Sensor schematic and experimental set up. (A) The first mode of resonance is shown with the mass sensitivity (color bar) normalized to its maximum value. Modal analysis of cantilevers in liquid via finite element simulations show that they have a spatially nonuniform mass sensitivity or error due to cell positioning of greater than 100% from the free end of the cantilever to the middle of the cantilever (top image), whereas resonating platform designs demonstrate spatial nonuniformity of mass sensitivity or error due to cell position to be less than 4% from the center to the edge of the platform (bottom image). (B) SEM image showing a sensor array; an individual sensor is shown in the inset. (C) Schematic diagram summarizing the automated frequency measurements setup. (D) Frequency response of the sensor with (orange) and without (blue) cell.
Fig. 2.
Fig. 2.
Measurement of frequency shift of adherent cells on pedestal sensors for extracting material properties of the cells. (A) The resonant frequency shift (decrease) is directly related to cell volume of attached cells, confirming the general trend that an increase in cell volume (and mass) decreases the resonant frequency. (B) The apparent mass of HT29 cells after fixation is 1.4 times greater than before fixation. (C) Schematics of dynamical models demonstrating the conventional “mass-spring-damper system” (left), and the improved mass-spring-damper system used to obtain the Young’s modulus, and cell mass from experimental data. (D) A three-dimensional plot summarizing how cell stiffness (Young’s modulus) and viscosity influence mass measurement (mass reading ratio is apparent mass divided by actual mass). The estimated Young’s modulus and viscosity from the 2-DOF model is 4.09 ± 1.22 kPa and 4 ± 2 mPa·s. (E) Calculated dependence of the mass reading ratio on the stiffness of the cell is shown in orange curve (see Materials and Methods) and a normalized histogram of the Young’s modulus is shown in blue curve (see Materials and Methods). (F) The effect of the cell geometry to the mass measurement of a cell with a constant volume. In vitro, an HT29 cell is observed to have the contact area of 200 ∼ 300 μm2 (Fig. S3B).
Fig. 3.
Fig. 3.
Mass measurement of adherent cells versus time. (A) A mass decrease is observed when dead cells or debris are removed during media changes, an internal measurement control. (B) The mass increase of a single adherent cell (blue line) with a linear curve fitting (orange line, y = 0.0513x + 0.3848). (C) Prior to cell division, an individual cell growth data (blue line) conforms to an exponential curve fitting (orange line, y = 0.5303e0.0353x). Cell division events are marked by sharp mass decreases (inset 1–3), as confirmed by numerical modeling. (D) Mass changes versus time of an inherently synchronized cell growing and dividing into two and four cells; three divisions distinguish the growth profiles.
Fig. 4.
Fig. 4.
Analysis of cell growth rate versus cell mass. (A) Relative mass increases from 12 different individual cells. For single cell growth analysis, the data was analyzed prior to mitotic events (two divisions are shown, arrowheads). (B) Five histograms account for all cell mass accumulation data of cells. Top plot shows the background noise of an empty sensor while the bottom four plots show an increasing distribution of mass; data bins are nonoverlapping and show average cell mass per bin. (C) Average cells acquire an additional 3.25% of its whole cell mass every hour. The log–log relation in the inset shows a power law of < 1, which is consistent with scaling rules of energy consumption versus size of an organism (31). (D) Background sensor (orange curve) and cell data (black curve) are from a single cell.

Similar articles

Cited by

References

    1. Cooper S. Distinguishing between linear and exponential cell growth during the division cycle: Single-cell studies, cell-culture studies, and the object of cell-cycle research. Theor Biol Med Model. 2006;3:10–24. - PMC - PubMed
    1. Killander D, Zetterberg A. Quantitative cytochemical studies on interphase growth. I. Determination of DNA, RNA and mass content of age determined mouse fibroblasts in vitro and of intercellular variation in generation time. Exp Cell Res. 1965;38:272–284. - PubMed
    1. Mitchison JM. Growth during the cell cycle. Int Rev Cytol. 2003;226:165–258. - PubMed
    1. Mitchison JM. Single cell studies of the cell cycle and some models. Theor Biol Med Model. 2005;2:4–8. - PMC - PubMed
    1. Zetterberg A, Killander D. Quantitative cytochemical studies on interphase growth. 2. Derivation of synthesis curves from distribution of DNA, RNA and mass values of individual mouse fibroblasts in vitro. Exp Cell Res. 1965;39:22–32. - PubMed

Publication types

LinkOut - more resources