

Tapping linked to function and structure in premanifest and symptomatic Huntington disease
- PMID: 21068430
- PMCID: PMC3013584
- DOI: 10.1212/WNL.0b013e3182020123
Tapping linked to function and structure in premanifest and symptomatic Huntington disease
Abstract
Objective: Motor signs are functionally disabling features of Huntington disease. Characteristic motor signs define disease manifestation. Their severity and onset are assessed by the Total Motor Score of the Unified Huntington's Disease Rating Scale, a categorical scale limited by interrater variability and insensitivity in premanifest subjects. More objective, reliable, and precise measures are needed which permit clinical trials in premanifest populations. We hypothesized that motor deficits can be objectively quantified by force-transducer-based tapping and correlate with disease burden and brain atrophy.
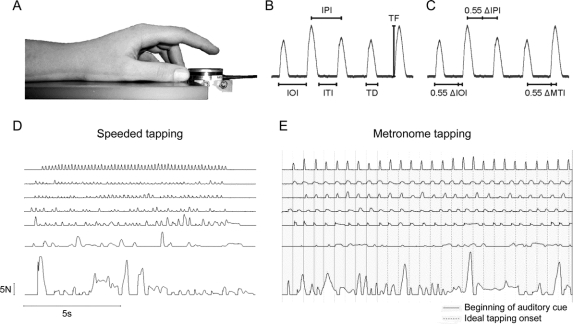
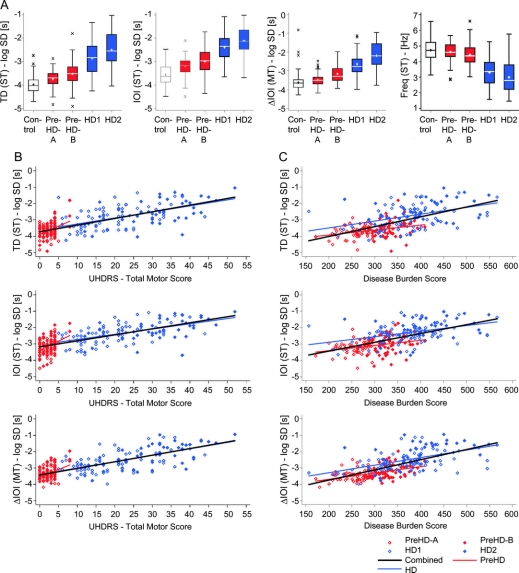
Methods: A total of 123 controls, 120 premanifest, and 123 early symptomatic gene carriers performed a speeded and a metronome tapping task in the multicenter study TRACK-HD. Total Motor Score, CAG repeat length, and MRIs were obtained. The premanifest group was subdivided into A and B, based on the proximity to estimated disease onset, the manifest group into stages 1 and 2, according to their Total Functional Capacity scores. Analyses were performed centrally and blinded.
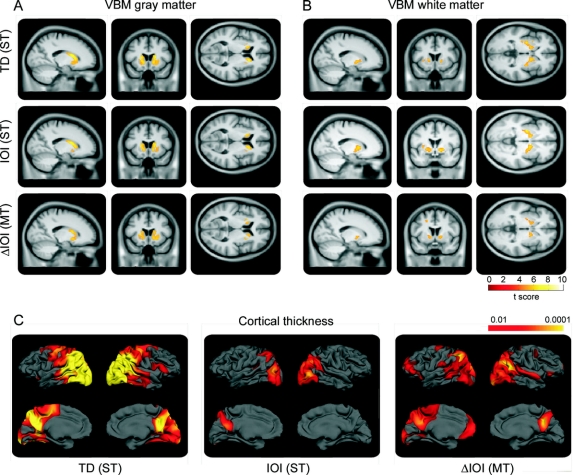
Results: Tapping variability distinguished between all groups and subgroups in both tasks and correlated with 1) disease burden, 2) clinical motor phenotype, 3) gray and white matter atrophy, and 4) cortical thinning. Speeded tapping was more sensitive to the detection of early changes.
Conclusion: Tapping deficits are evident throughout manifest and premanifest stages. Deficits are more pronounced in later stages and correlate with clinical scores as well as regional brain atrophy, which implies a link between structure and function. The ability to track motor phenotype progression with force-transducer-based tapping measures will be tested prospectively in the TRACK-HD study.
Figures
Comment in
-
Tapping in Huntington disease: a path forward to preventive therapies?Neurology. 2010 Dec 14;75(24):2142-3. doi: 10.1212/WNL.0b013e318203f0cd. Epub 2010 Nov 10. Neurology. 2010. PMID: 21068428 No abstract available.
References
-
- Aylward EH, Brandt J, Codori AM, Mangus RS, Barta PE, Harris GJ. Reduced basal ganglia volume associated with the gene for Huntington's disease in asymptomatic at-risk persons. Neurology 1994;44:823–828. - PubMed
-
- Reading SA, Yassa MA, Bakker A, et al. Regional white matter change in pre-symptomatic Huntington's disease: a diffusion tensor imaging study. Psychiatry Res 2005;140:55–62. - PubMed
-
- Rosas HD, Tuch DS, Hevelone ND, et al. Diffusion tensor imaging in presymptomatic and early Huntington's disease: Selective white matter pathology and its relationship to clinical measures. Mov Disord 2006;21:1317–1325. - PubMed
-
- Marder K, Zhao H, Myers RH, et al. Rate of functional decline in Huntington's disease: Huntington Study Group. Neurology 2000;54:452–458. - PubMed
Publication types
MeSH terms
Substances
Grants and funding
LinkOut - more resources
Full Text Sources
Other Literature Sources
Medical