

A method for detection of residual confounding in time-series and other observational studies
- PMID: 21068669
- PMCID: PMC3743227
- DOI: 10.1097/EDE.0b013e3181fdcabe
A method for detection of residual confounding in time-series and other observational studies
Abstract
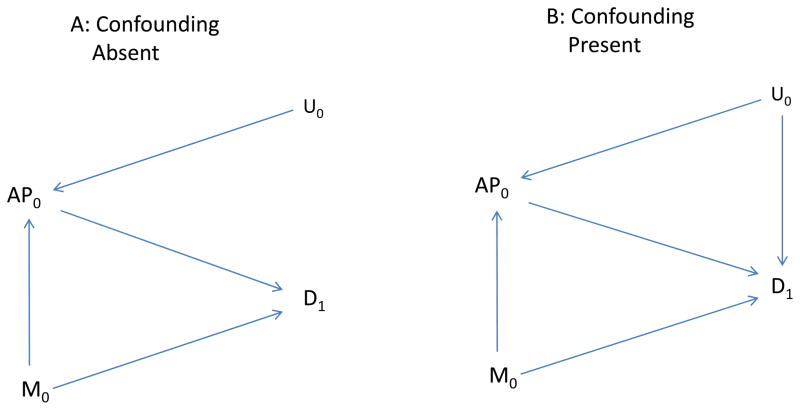
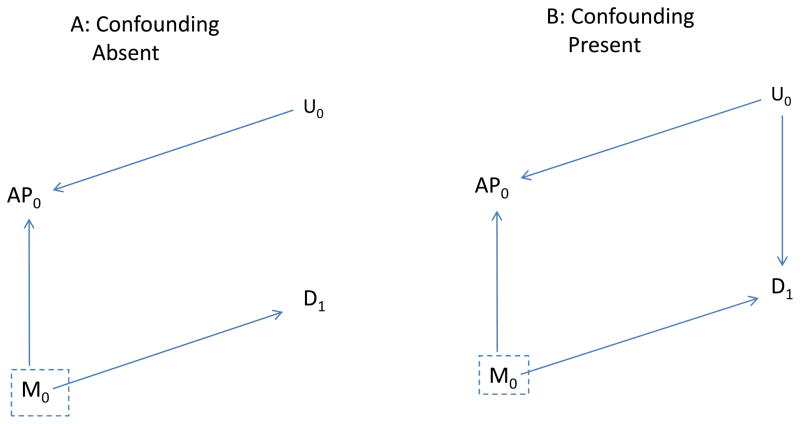
Background: A difficult issue in observational studies is assessment of whether important confounders are omitted or misspecified. In this study, we present a method for assessing whether residual confounding is present. Our method depends on availability of an indicator with 2 key characteristics: first, it is conditionally independent (given measured exposures and covariates) of the outcome in the absence of confounding, misspecification, and measurement errors; second, it is associated with the exposure and, like the exposure, with any unmeasured confounders.
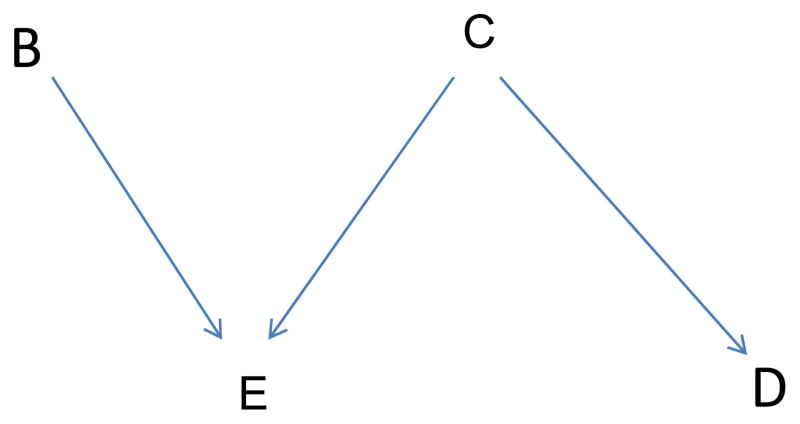
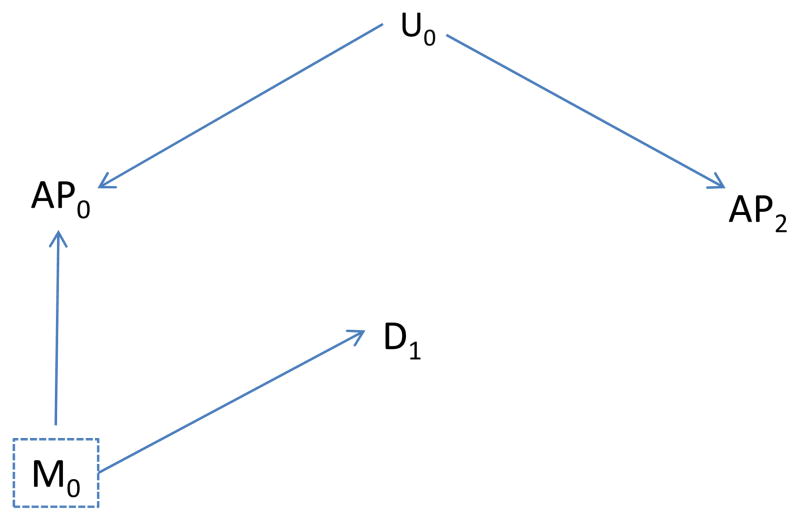
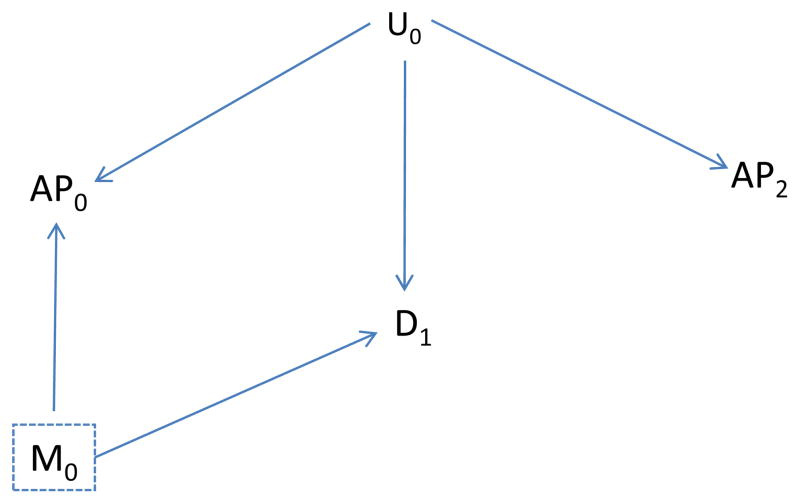
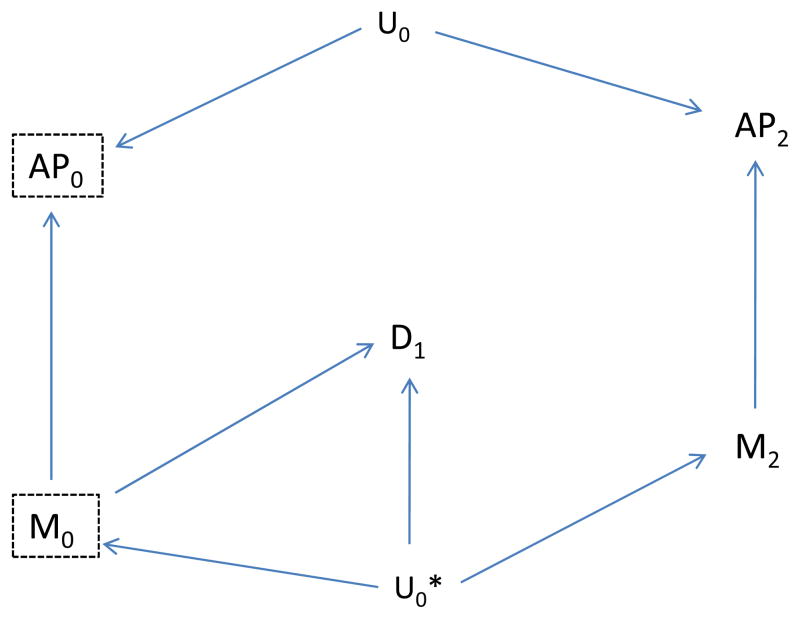
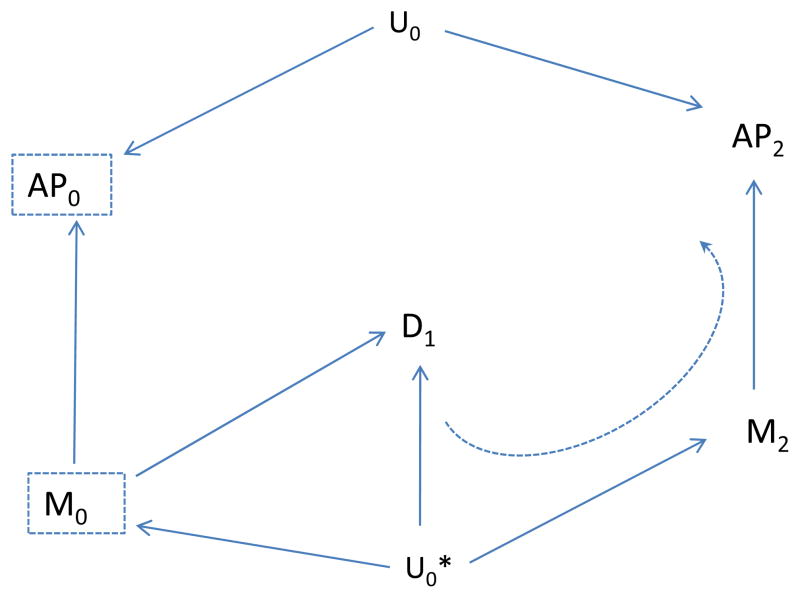
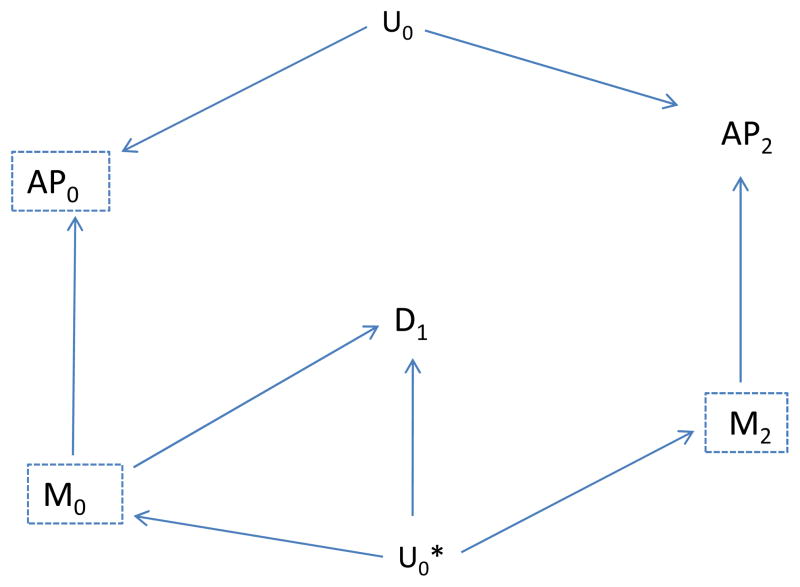
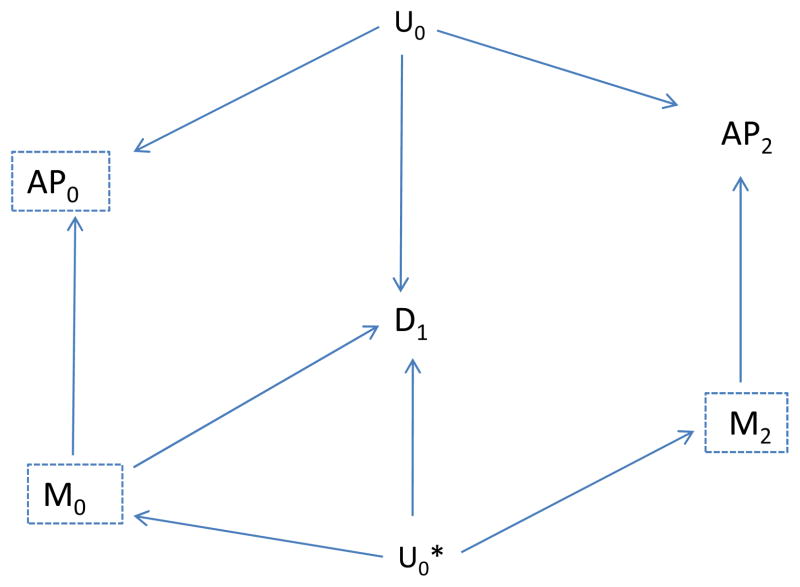
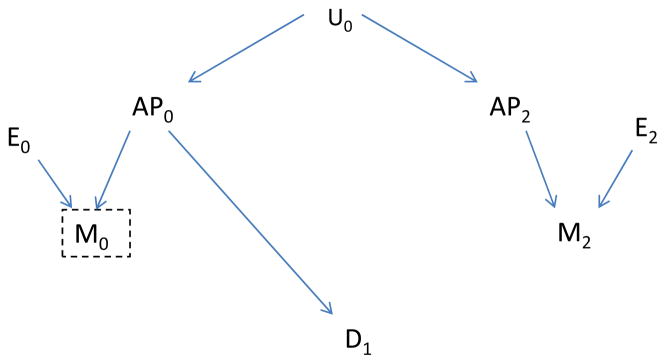
Methods: We demonstrate the method using a time-series study of the effects of ozone on emergency department visits for asthma in Atlanta. We argue that future air pollution may have the characteristics appropriate for an indicator, in part because future ozone cannot have caused yesterday's health events. Using directed acyclic graphs and specific causal relationships, we show that one can identify residual confounding using an indicator with the stated characteristics. We use simulations to assess the discriminatory ability of future ozone as an indicator of residual confounding in the association of ozone with asthma-related emergency department visits. Parameter choices are informed by observed data for ozone, meteorologic factors, and asthma.
Results: In simulations, we found that ozone concentrations 1 day after the emergency department visits had excellent discriminatory ability to detect residual confounding by some factors that were intentionally omitted from the model, but weaker ability for others. Although not the primary goal, the indicator can also signal other forms of modeling errors, including substantial measurement error, and does not distinguish between them.
Conclusions: The simulations illustrate that the indicator based on future air pollution levels can have excellent discriminatory ability for residual confounding, although performance varied by situation. Application of the method should be evaluated by considering causal relationships for the intended application, and should be accompanied by other approaches, including evaluation of a priori knowledge.
Figures
Similar articles
-
A method to detect residual confounding in spatial and other observational studies.Epidemiology. 2011 Nov;22(6):823-6. doi: 10.1097/EDE.0b013e3182305dac. Epidemiology. 2011. PMID: 21968772 Free PMC article.
-
A New Method for Partial Correction of Residual Confounding in Time-Series and Other Observational Studies.Am J Epidemiol. 2017 May 15;185(10):941-949. doi: 10.1093/aje/kwx013. Am J Epidemiol. 2017. PMID: 28430842
-
Effects of short-term exposure to air pollution on hospital admissions of young children for acute lower respiratory infections in Ho Chi Minh City, Vietnam.Res Rep Health Eff Inst. 2012 Jun;(169):5-72; discussion 73-83. Res Rep Health Eff Inst. 2012. PMID: 22849236
-
Short-term exposure to ozone, nitrogen dioxide, and sulphur dioxide and emergency department visits and hospital admissions due to asthma: A systematic review and meta-analysis.Environ Int. 2021 May;150:106435. doi: 10.1016/j.envint.2021.106435. Epub 2021 Feb 15. Environ Int. 2021. PMID: 33601224
-
Air Pollution and Autism Spectrum Disorders: Causal or Confounded?Curr Environ Health Rep. 2015 Dec;2(4):430-9. doi: 10.1007/s40572-015-0073-9. Curr Environ Health Rep. 2015. PMID: 26399256 Free PMC article. Review.
Cited by
-
Epidemiology beyond its limits.Sci Adv. 2022 Jun 10;8(23):eabn3328. doi: 10.1126/sciadv.abn3328. Epub 2022 Jun 8. Sci Adv. 2022. PMID: 35675391 Free PMC article.
-
Acute Effects of Ambient Air Pollution on Asthma Emergency Department Visits in Ten U.S. States.Environ Health Perspect. 2023 Apr;131(4):47003. doi: 10.1289/EHP11661. Epub 2023 Apr 3. Environ Health Perspect. 2023. PMID: 37011135 Free PMC article.
-
Incorporating genetic data improves target trial emulations and informs the use of polygenic scores in randomized controlled trial design.Nat Genet. 2025 Jul;57(7):1620-1627. doi: 10.1038/s41588-025-02229-8. Epub 2025 Jun 18. Nat Genet. 2025. PMID: 40533517 Free PMC article.
-
Traffic-Related Air Pollution and Autism Spectrum Disorder: A Population-Based Nested Case-Control Study in Israel.Am J Epidemiol. 2018 Apr 1;187(4):717-725. doi: 10.1093/aje/kwx294. Am J Epidemiol. 2018. PMID: 29020136 Free PMC article.
-
Estimating Causal Associations of Fine Particles With Daily Deaths in Boston.Am J Epidemiol. 2015 Oct 1;182(7):644-50. doi: 10.1093/aje/kwv101. Epub 2015 Sep 6. Am J Epidemiol. 2015. PMID: 26346544 Free PMC article.
References
-
- Hastie T, Tibshirani R, Friedman J. The Elements of Statistical Learning. New York: Springer-Verlag; 2001.
-
- Peng RD, Dominici F, Louis TA. Model choice in time series studies of air pollution and mortality. Roy Stat Soc A. 2006;169:179–203.
-
- Greenland S, Pearl J, Robins J. Causal Diagrams for Epidemiologic Research. Epidemiol. 1999;10:37–48. - PubMed
-
- Robins J. Data, design, and background knowledge in etiologic inference. Epidemiology. 2001;12(3):313–20. - PubMed
-
- Hernan MA, Hernandez-Diaz S, Werler MM, Mitchell AA. Causal knowledge as a prerequisite for confounding evaluation: an application to birth defects epidemiology. Am J Epidemiol. 2002;155(2):176–184. - PubMed
Publication types
MeSH terms
Substances
Grants and funding
LinkOut - more resources
Full Text Sources
