. 2011 Aug;68(15):2627-42.
doi: 10.1007/s00018-010-0575-4. Epub 2010 Nov 11.

Cell-specific and hypoxia-dependent regulation of human HIF-3α: inhibition of the expression of HIF target genes in vascular cells

Affiliations

Cell-specific and hypoxia-dependent regulation of human HIF-3α: inhibition of the expression of HIF target genes in vascular cells

Antje Augstein et al. Cell Mol Life Sci. 2011 Aug.

Abstract

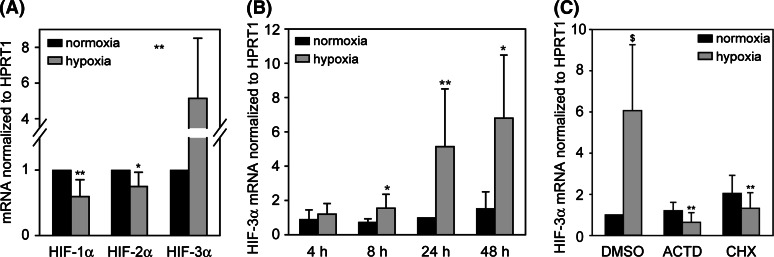
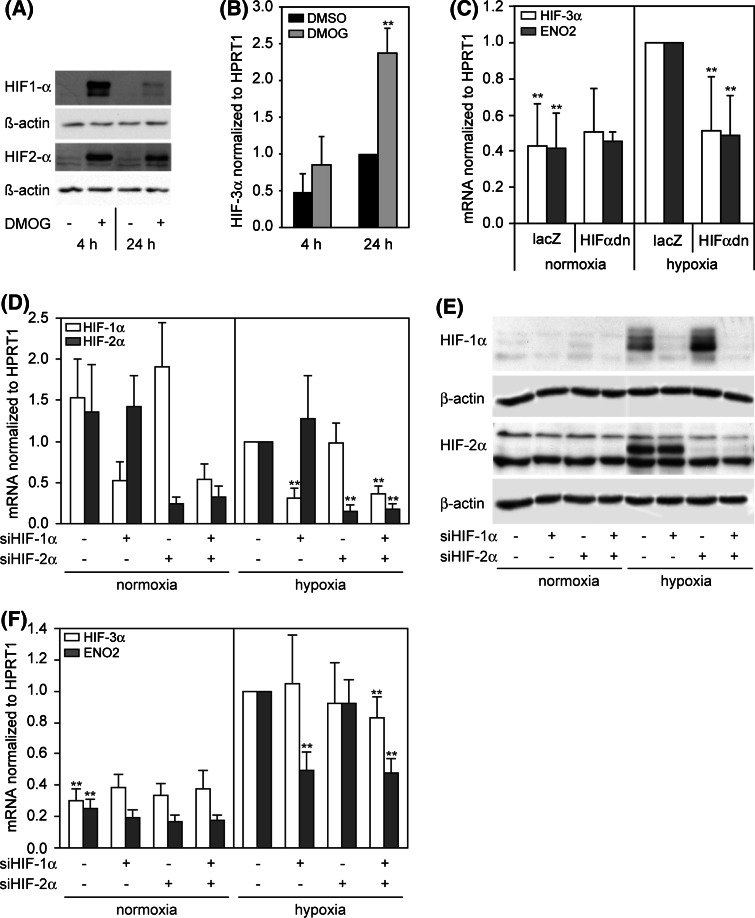
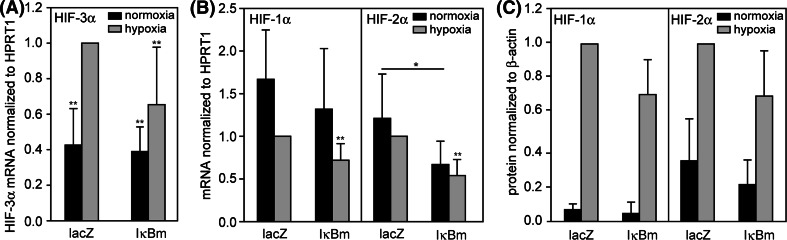
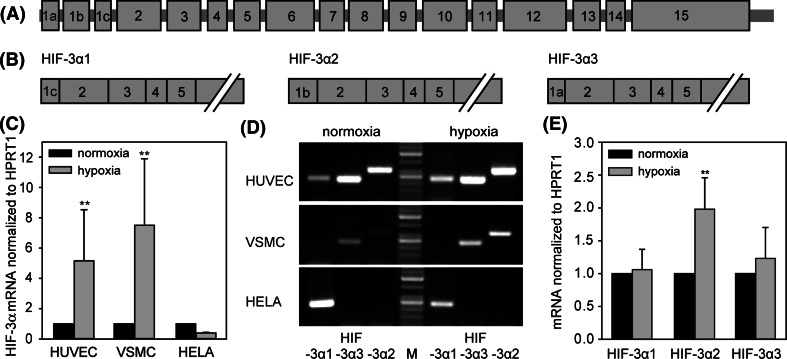
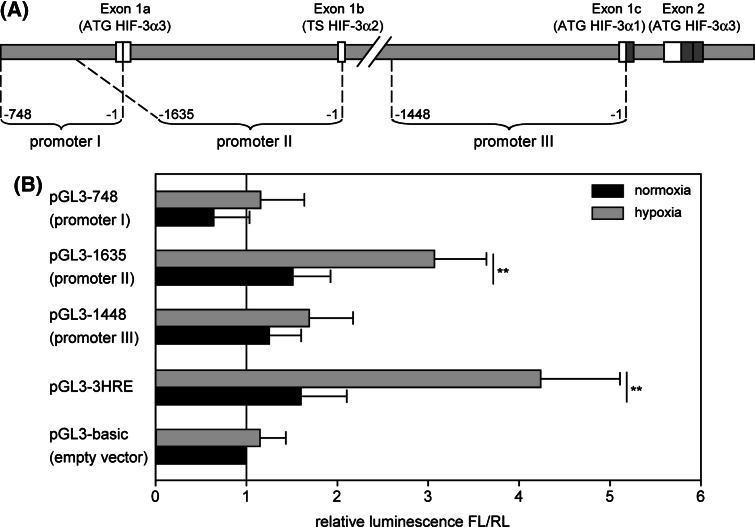
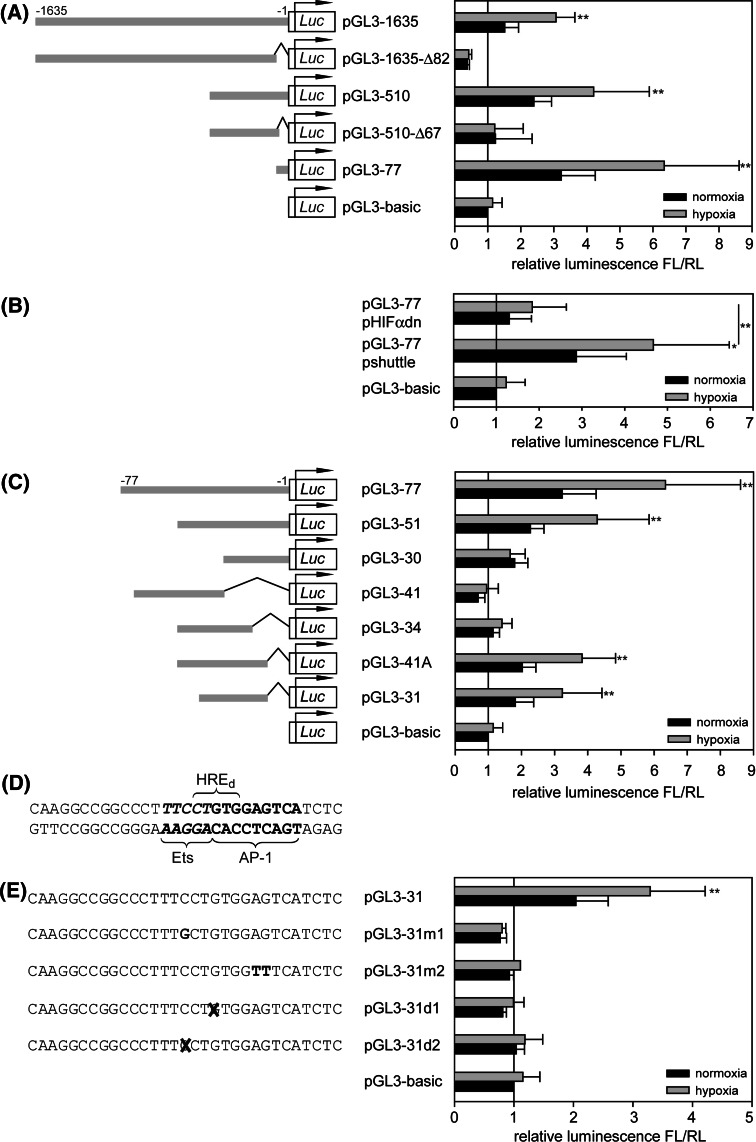
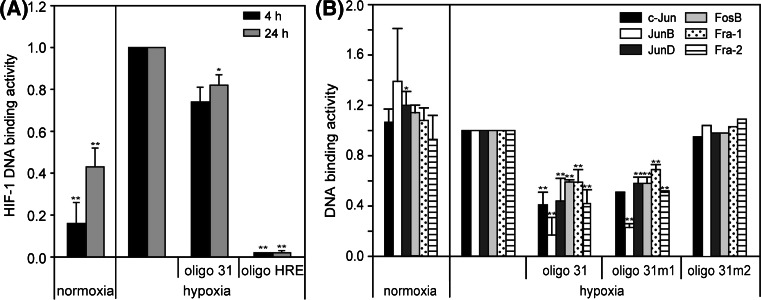
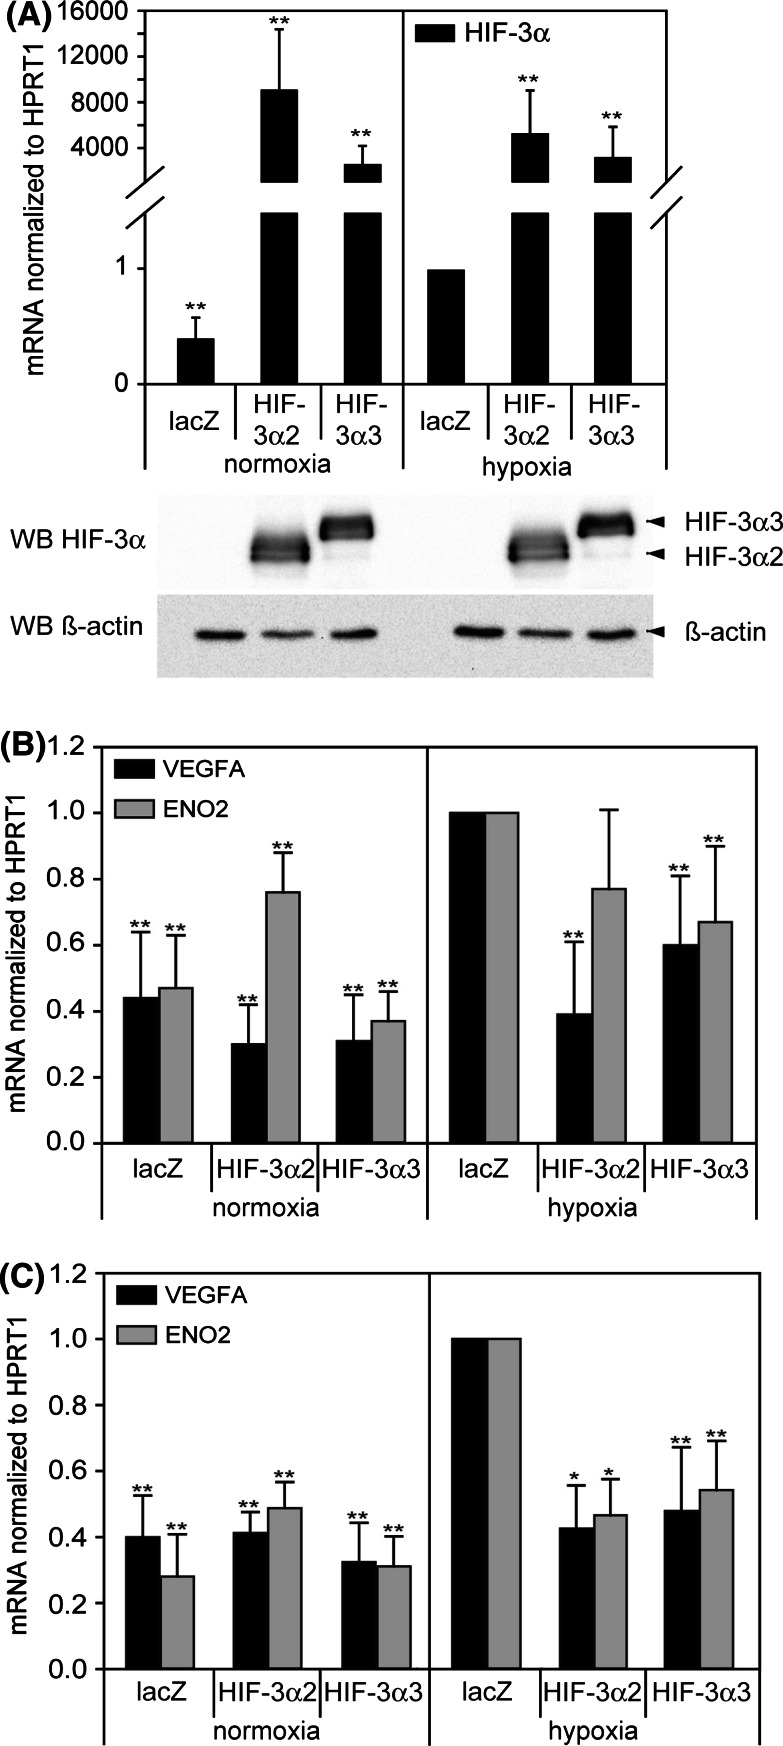
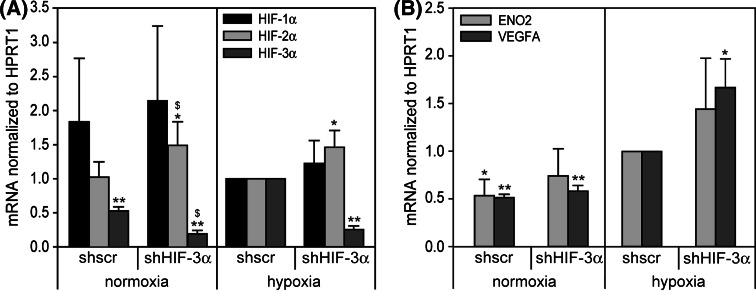
Hypoxia-inducible factors (HIF) are transcription factors responding to reduced oxygen levels and are of utmost importance for regulation of a widespread of cellular processes, e.g., angiogenesis. In contrast to HIF-1α/HIF-2α, the relevance of HIF-3α for the regulation of the HIF pathway in human vascular cells is largely unknown. HIF-3α mRNA increases under hypoxia in endothelial and vascular smooth muscle cells. Analysis of HIF-3α isoforms revealed a cell type-specific pattern, but only one isoform, HIF-3α2, is hypoxia-inducible. Reporter gene assays of the appropriate promoter localized a 31-bp fragment, mediating this hypoxic regulation. The contribution of HIF-1/2 and NFκB to the HIF-3α induction was verified. Functional studies focused on overexpression of HIF-3α isoforms, which decrease the hypoxia-mediated expression of VEGFA and Enolase2. These data support the notion of a hypoxia-induced inhibitory function of HIF-3α and demonstrate for the first time the existence of this negative regulation of HIF-signaling in vascular cells.


Conflict of interest statement

None declared.

Figures

Fig. 1
Fig. 1
a Differential regulation of α-subunit mRNA in HUVEC after 24 h hypoxia. *P < 0.05, **P < 0.01 hypoxia versus normoxia. b Hypoxia increases HIF-3α expression in HUVEC significantly after 8 h up to 48 h. *P < 0.025, **P < 0.005 hypoxia versus normoxia. Bonferroni correction considered. c Hypoxic upregulation of HIF-3α in HUVEC is inhibited after treatment with inhibitors of transcription and translation. Cells were preincubated for 2.5 h with solvent (DMSO), 0.5 μg/ml actinomycin D (ACTD) or 1 μg/ml cycloheximide (CHX) and then subjected to hypoxia for 22 h. Expression of mRNA was analyzed by real-time RT-PCR and calculated as relative values to normoxia (24 h). $ P < 0.01 versus DMSO/normoxia. **P < 0.005 versus DMSO/hypoxia, Bonferroni correction considered. Means and standard deviations are shown
Fig. 2
Fig. 2
a, b Dimethyloxalylglycine (DMOG) caused stabilization of HIF-1α and HIF-2α under normoxia and HIF-3α mRNA induction. HUVECs were incubated with solvent (DMSO) or 2.5 mM DMOG for 4 and 24 h. a DMOG causes a non-hypoxic stabilization of HIF-1α and HIF-2α protein as detected by Western blot. b HIF-3α mRNA is induced by DMOG comparable to hypoxia (n = 5). Expression of HIF-3α mRNA was analyzed by real-time RT-PCR and calculated as relative values to DMSO (24 h). **P < 0.01 DMOG versus DMSO. c Adenoviral overexpression of dominant-negative HIF-2α (HIFαdn) in HUVEC under normoxia/hypoxia. Cells were infected with virus expressing lacZ (control) or HIFαdn for 24 h, further incubated with fresh medium for 24 h and exposed to normoxia/hypoxia for 24 h. Data were calculated as relative values to hypoxia/lacZ. Hypoxic induction of HIF-3α mRNA is inhibited under overexpressed HIFαdn (n = 14). *P < 0.05, **P < 0.01 versus lacZ/hypoxia. de Transfection of HUVEC with siRNA targeting HIF-1α and HIF-2α. A siRNA with scrambled non-specific sequence was used in control samples. d Silencing of HIF-1α and HIF-2α mRNA 72 h posttransfection of respective siRNA relative to hypoxia. e Western blot detecting HIF-1α and HIF-2α 72 h posttransfection of respective siRNA shows clearly reduced protein levels under hypoxia. f Influence of HIF-1α and HIF-2α inhibition on expression of HIF-3α and ENO2 under normoxia and hypoxia (n = 4). *P < 0.05, **P < 0.01 versus hypoxia without specific siRNA. Means and standard deviations are shown
Fig. 3
Fig. 3
Adenoviral overexpression of constitutive active IκBα (IκBαm) in HUVEC under normoxia/hypoxia. Cells were infected with virus expressing lacZ (control) or IκBαm for 24 h, further incubated with fresh medium for 24 h and exposed to normoxia/hypoxia for 24 h. Data were calculated as relative values to hypoxia/lacZ. a Hypoxic expression of HIF-3α mRNA is decreased under overexpressed IκBαm. b Relative abundance of HIF-1α and HIF-2α mRNA is decreased under overexpressed IκBαm (n = 5). c Influence of overexpressed IκBαm on HIF-1α and HIF-2α protein levels (n = 4). *P < 0.05, **P < 0.01 versus lacZ/hypoxia. Means and standard deviations are shown
Fig. 4
Fig. 4
Cell-specific expression of HIF-3α. a Genomic organization of HIF-3α gene locus on chromosome 19. b Organization of isoform-specific mRNA for HIF-3α1, HIF-3α2 and HIF-3α3. c Variable regulation of HIF-3α in different cell types after 24 h hypoxia. Expression of HIF-3α mRNA was calculated as relative values to HUVEC/normoxia. d Analysis of qualitative isoform-specific RT-PCR products shows cell-specific expression of HIF-3α isoforms. (M) DNA ladder. e Estimation of hypoxia-modulated HIF-3α isoform. HUVECs were incubated under normoxic or hypoxic conditions for 24 h; HIF-3α isoforms were detected by isoform-specific RT-PCR and evaluated by agarose gel electrophoresis. Calculation of relative HIF-3α signal intensities was carried out with the in parallel measured housekeeping gene HPRT1 (n = 6). Expression of mRNA was calculated as relative values to normoxia. **P < 0.01 hypoxia versus normoxia. Means and standard deviations are shown
Fig. 5
Fig. 5
Detection of hypoxia-inducible HIF-3α promoter. a Putative promoter sequences upstream of exon 1a, exon 1b and exon 1c were cloned into pGL3-basic encoding firefly luciferase. b Luciferase activity of transfected HUVEC under normoxic and hypoxic conditions. pGL3-3HRE expressing firefly luciferase under control of three consecutive hypoxia response elements is used as positive control. Promoter activities are calculated as quotient of firefly luciferase and renilla luciferase luminescence levels relative to pGL3-basic (n ≥ 4). *P < 0.025, **P < 0.005 hypoxia versus normoxia, Bonferroni correction (k = 2) considered. TS transcription start. Means and standard deviations are shown
Fig. 6
Fig. 6
Identification of functional transcription factor binding sites of HIF-3α promoter II. Sequences corresponding to specific promoter fragments were cloned into pGL3-basic and transfected into HUVEC. Promoter activities are calculated as quotient of firefly luciferase and renilla luciferase luminescence levels relative to pGL3-basic. a Successive deletions of HIF-3α promoter II (n  ≥ 3). b Contribution of HIF pathway to promoter activity of the 77-bp element. pHIFαdn or pshuttle (control) were co-transfected with pGL3-77 into HUVEC (n = 7). c Deletions of 77-bp promoter fragment (n ≥ 3). d Sequence of 31-bp promoter element with labeled potential transcription factor binding sites. HREd, degenerated HRE; e mutations and deletions of the 31-bp sequence in the potential Ets and AP-1 recognition sites revealed inhibition of luciferase expression to basic level (n ≥ 3). *P < 0.025, **P < 0.005 hypoxia versus normoxia, Bonferroni correction (k = 2) considered. Means and standard deviations are shown
Fig. 7
Fig. 7
TransAM™ DNA binding assay. Binding activities were calculated as relative values to hypoxia. a HUVECs were cultivated under normoxia and hypoxia for 4 and 24 h, nuclear protein extracts were isolated, and HIF-1 DNA binding activity was measured. Data were shown as values relative to hypoxia. For competitive binding experiments oligo 31 and oligo HRE were applied. b HUVECs were cultivated under normoxia and hypoxia for 24 h, nuclear protein extracts were isolated, and AP-1 family DNA binding activity was measured. For competitive binding experiments oligo 31, oligo 31m1 and oligo 31m2 were applied. *P < 0.05, **P < 0.01 versus hypoxia. Means and standard deviations are shown
Fig. 8
Fig. 8
Confirmation of inhibitory behavior of overexpressed HIF-3α2 and HIF-3α3 on expression of HIF target genes VEGFA and ENO2 in HUVEC (b) and VSMC (c). Cells were infected with adenovirus overexpressing lacZ (control), HIF-3α2 or HIF-3α3, and subsequently exposed to normoxia/hypoxia for 24 h. a Overexpression of HIF-3α isoforms in HUVEC was measured by real-time RT-PCR and Western blot. b, c Expression of VEGFA and ENO2 mRNA was analyzed by real-time RT-PCR and calculated as relative values to hypoxia/lacZ. *P < 0.05, **P < 0.01 versus hypoxia/lacZ. Means and standard deviations are shown
Fig. 9
Fig. 9
Adenoviral expression of shRNA targeting HIF-3α in HUVEC. Cells were infected with adenovirus expressing shscr (scrambled control shRNA) or shHIF-3α for 48 h and subsequently exposed to normoxia/hypoxia for 24 h. a Expression of HIF-α subunits was measured by real-time RT-PCR calculated as relative values to hypoxia/lacZ. b Expression of ENO2 and VEGFA mRNA was analyzed by real-time RT-PCR and calculated as relative values to hypoxia/lacZ. *P < 0.05, **P < 0.01 versus hypoxia/shscr. $ P < 0.05 vs.normoxia/shscr. Means and standard deviations are shown

Similar articles

Cited by

References

    1. Bjornheden T, Levin M, Evaldsson M, Wiklund O. Evidence of hypoxic areas within the arterial wall in vivo. Arterioscler Thromb Vasc Biol. 1999;19:870–876. doi: 10.1161/01.ATV.19.4.870. - DOI - PubMed
    1. Celletti FL, Waugh JM, Amabile PG, Brendolan A, Hilfiker PR, Dake MD. Vascular endothelial growth factor enhances atherosclerotic plaque progression. Nat Med. 2001;7:425–429. doi: 10.1038/86490. - DOI - PubMed
    1. Chen F, Eriksson P, Kimura T, Herzfeld I, Valen G. Apoptosis and angiogenesis are induced in the unstable coronary atherosclerotic plaque. Coron Artery Dis. 2005;16:191–197. doi: 10.1097/00019501-200505000-00009. - DOI - PubMed
    1. Sluimer JC, Gasc JM, van Wanroij JL, Kisters N, Groeneweg M, Sollewijn G, Cleutjens JP, van den Akker LH, Corvol P, Wouters BG, Daemen MJ, Bijnens AP. Hypoxia, hypoxia-inducible transcription factor, and macrophages in human atherosclerotic plaques are correlated with intraplaque angiogenesis. J Am Coll Cardiol. 2008;51:1258–1265. doi: 10.1016/j.jacc.2007.12.025. - DOI - PubMed
    1. Luque A, Turu M, Juan-Babot O, Cardona P, Font A, Carvajal A, Slevin M, Iborra E, Rubio F, Badimon L, Krupinski J. Overexpression of hypoxia/inflammatory markers in atherosclerotic carotid plaques. Front Biosci. 2008;13:6483–6490. doi: 10.2741/3168. - DOI - PubMed

MeSH terms

LinkOut - more resources