

Anatomic magnetic resonance imaging of the developing child and adolescent brain and effects of genetic variation
- PMID: 21069466
- PMCID: PMC3268519
- DOI: 10.1007/s11065-010-9151-9
Anatomic magnetic resonance imaging of the developing child and adolescent brain and effects of genetic variation
Abstract
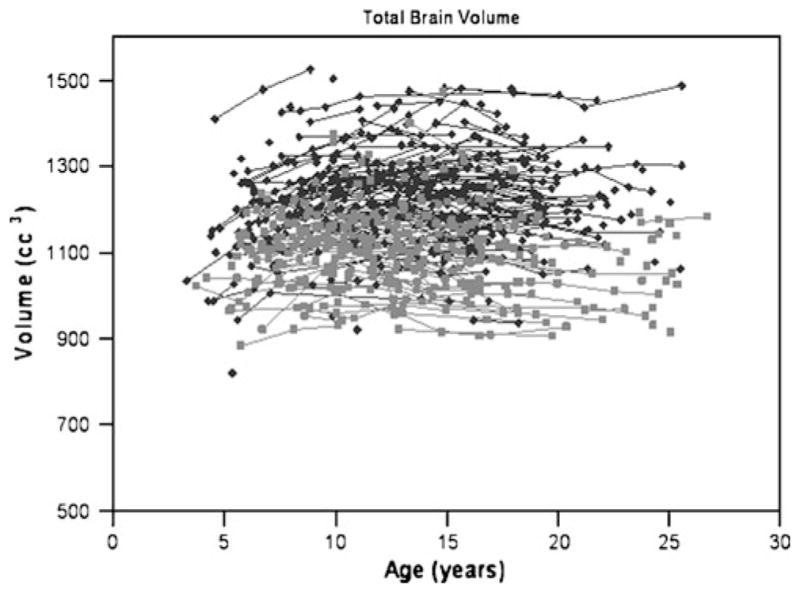
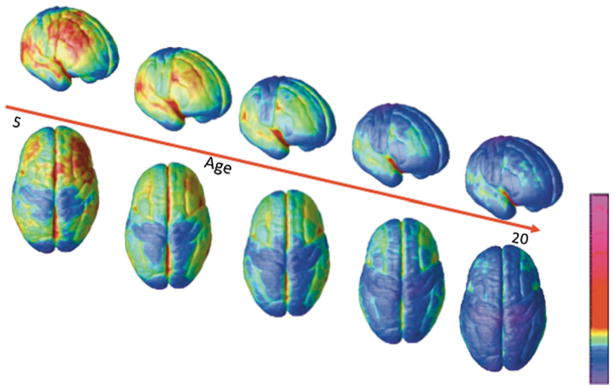
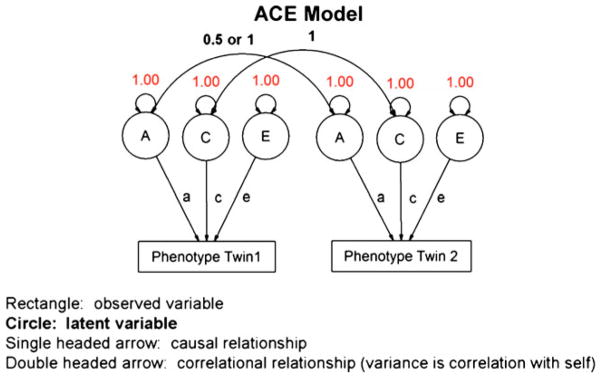
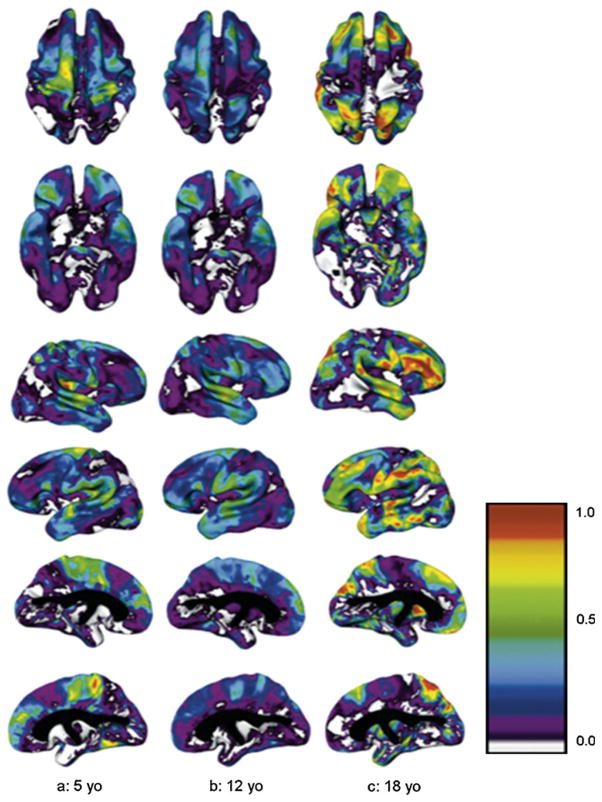
Magnetic resonance imaging studies have begun to map effects of genetic variation on trajectories of brain development. Longitudinal studies of children and adolescents demonstrate a general pattern of childhood peaks of gray matter followed by adolescent declines, functional and structural increases in connectivity and integrative processing, and a changing balance between limbic/subcortical and frontal lobe functions, which extends well into young adulthood. Twin studies have demonstrated that genetic factors are responsible for a significant amount of variation in pediatric brain morphometry. Longitudinal studies have shown specific genetic polymorphisms affect rates of cortical changes associated with maturation. Although over-interpretation and premature application of neuroimaging findings for diagnostic purposes remains a risk, converging data from multiple imaging modalities is beginning to elucidate the influences of genetic factors on brain development and implications of maturational changes for cognition, emotion, and behavior.
Figures

Similar articles
-
The teen brain: insights from neuroimaging.J Adolesc Health. 2008 Apr;42(4):335-43. doi: 10.1016/j.jadohealth.2008.01.007. J Adolesc Health. 2008. PMID: 18346658 Review.
-
The changing impact of genes and environment on brain development during childhood and adolescence: initial findings from a neuroimaging study of pediatric twins.Dev Psychopathol. 2008 Fall;20(4):1161-75. doi: 10.1017/S0954579408000552. Dev Psychopathol. 2008. PMID: 18838036 Free PMC article. Review.
-
Brain development in children and adolescents: insights from anatomical magnetic resonance imaging.Neurosci Biobehav Rev. 2006;30(6):718-29. doi: 10.1016/j.neubiorev.2006.06.001. Epub 2006 Aug 2. Neurosci Biobehav Rev. 2006. PMID: 16887188 Review.
-
Mapping continued brain growth and gray matter density reduction in dorsal frontal cortex: Inverse relationships during postadolescent brain maturation.J Neurosci. 2001 Nov 15;21(22):8819-29. doi: 10.1523/JNEUROSCI.21-22-08819.2001. J Neurosci. 2001. PMID: 11698594 Free PMC article. Clinical Trial.
-
Mapping cortical asymmetry and complexity patterns in normal children.Psychiatry Res. 2001 Jul 1;107(1):29-43. doi: 10.1016/s0925-4927(01)00091-9. Psychiatry Res. 2001. PMID: 11472862
Cited by
-
The role of nutrition in children's neurocognitive development, from pregnancy through childhood.Front Hum Neurosci. 2013 Mar 26;7:97. doi: 10.3389/fnhum.2013.00097. eCollection 2013. Front Hum Neurosci. 2013. PMID: 23532379 Free PMC article.
-
Prenatal stress and peripubertal stimulation of the endocannabinoid system differentially regulate emotional responses and brain metabolism in mice.PLoS One. 2012;7(7):e41821. doi: 10.1371/journal.pone.0041821. Epub 2012 Jul 25. PLoS One. 2012. PMID: 22848620 Free PMC article.
-
Gender differences in brain processes during inhibition of manual movements programs.Ann Neurosci. 2019 Jan;26(1):4-9. doi: 10.5214/ans.0972.7531.260103. Epub 2019 Jan 1. Ann Neurosci. 2019. PMID: 31975766 Free PMC article.
-
Nutritional quality of diet and academic performance in Chilean students.Bull World Health Organ. 2016 Mar 1;94(3):185-92. doi: 10.2471/BLT.15.161315. Epub 2016 Feb 3. Bull World Health Organ. 2016. PMID: 26966329 Free PMC article.
-
Genetic correlates of the development of theta event related oscillations in adolescents and young adults.Int J Psychophysiol. 2017 May;115:24-39. doi: 10.1016/j.ijpsycho.2016.11.007. Epub 2016 Nov 12. Int J Psychophysiol. 2017. PMID: 27847216 Free PMC article.
References
-
- Baare WF, Hulshoff Pol HE, Boomsma DI, Posthuma D, de Geus EJ, Schnack HG, et al. Quantitative genetic modeling of variation in human brain morphology. Cerebral Cortex. 2001;11(9):816–824. - PubMed
-
- Berlucchi G. Interhemispheric asymmetries in visual discrimination: a neurophysiological hypothesisDocumenta ophthalmologica. Proceedings series. 1981;30:87–93.
-
- Braitenberg V. Brain size and number of neurons: an exercise in synthetic neuroanatomy. Journal of Computational Neuroscience. 2001;10(1):71–77. - PubMed
Publication types
MeSH terms
Grants and funding
LinkOut - more resources
Full Text Sources
Medical
