

Development of a new physics-based internal coordinate mechanics force field and its application to protein loop modeling
- PMID: 21069716
- PMCID: PMC3057902
- DOI: 10.1002/prot.22896
Development of a new physics-based internal coordinate mechanics force field and its application to protein loop modeling
Abstract
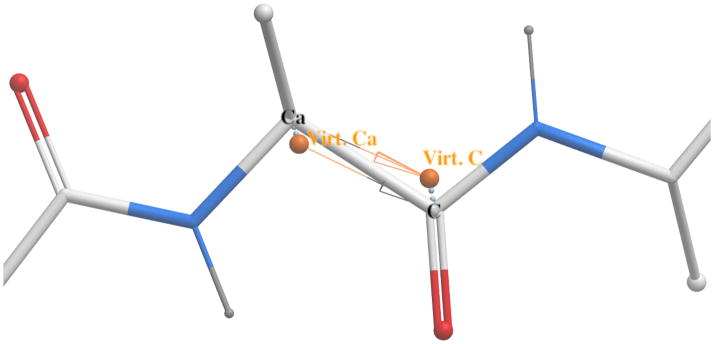
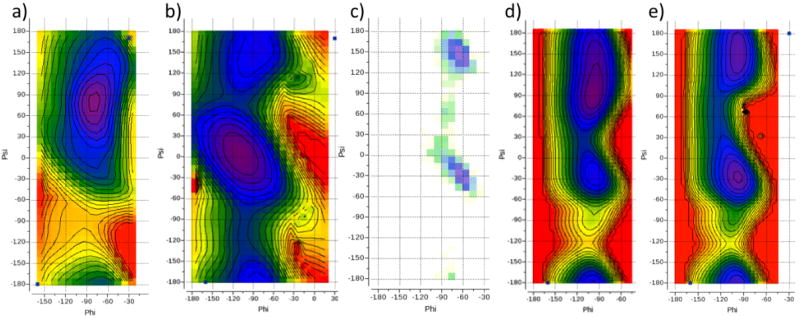
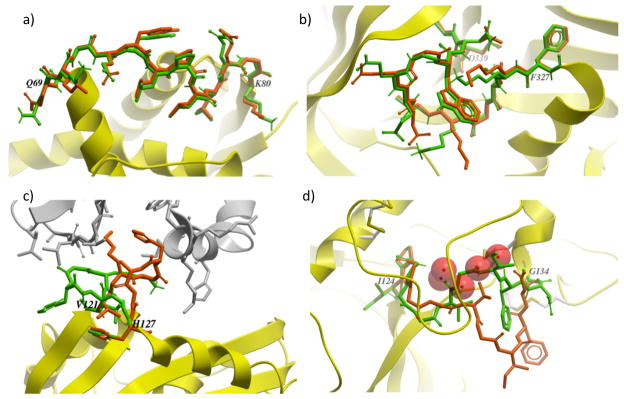
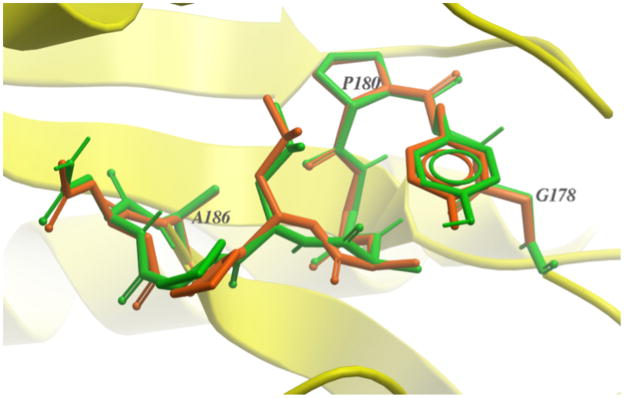
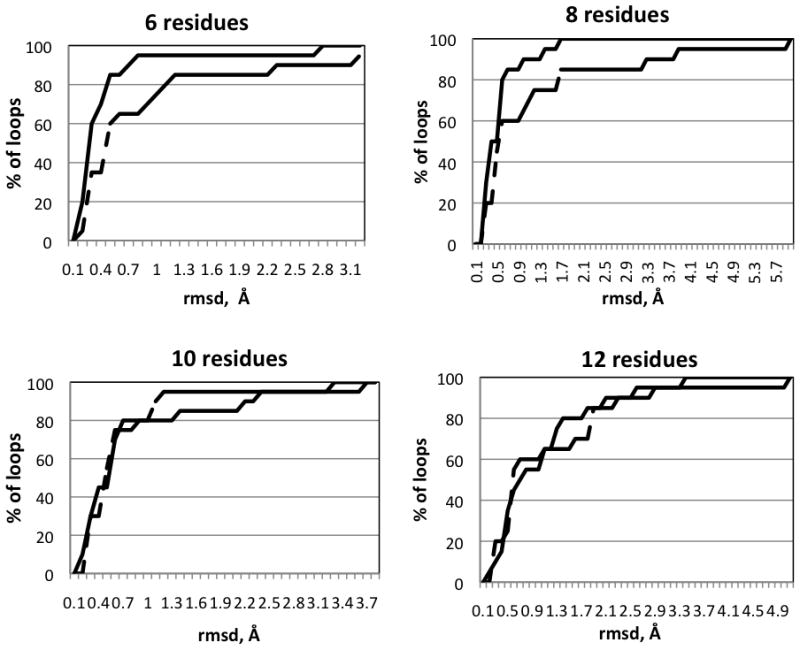
We report the development of internal coordinate mechanics force field (ICMFF), new force field parameterized using a combination of experimental data for crystals of small molecules and quantum mechanics calculations. The main features of ICMFF include: (a) parameterization for the dielectric constant relevant to the condensed state (ε = 2) instead of vacuum, (b) an improved description of hydrogen-bond interactions using duplicate sets of van der Waals parameters for heavy atom-hydrogen interactions, and (c) improved backbone covalent geometry and energetics achieved using novel backbone torsional potentials and inclusion of the bond angles at the C(α) atoms into the internal variable set. The performance of ICMFF was evaluated through loop modeling simulations for 4-13 residue loops. ICMFF was combined with a solvent-accessible surface area solvation model optimized using a large set of loop decoys. Conformational sampling was carried out using the biased probability Monte Carlo method. Average/median backbone root-mean-square deviations of the lowest energy conformations from the native structures were 0.25/0.21 Å for four residues loops, 0.84/0.46 Å for eight residue loops, and 1.16/0.73 Å for 12 residue loops. To our knowledge, these results are significantly better than or comparable with those reported to date for any loop modeling method that does not take crystal packing into account. Moreover, the accuracy of our method is on par with the best previously reported results obtained considering the crystal environment. We attribute this success to the high accuracy of the new ICM force field achieved by meticulous parameterization, to the optimized solvent model, and the efficiency of the search method.
© 2010 Wiley-Liss, Inc.
Figures
Similar articles
-
All-Atom Internal Coordinate Mechanics (ICM) Force Field for Hexopyranoses and Glycoproteins.J Chem Theory Comput. 2015 May 12;11(5):2167-2186. doi: 10.1021/ct501138c. Epub 2015 Apr 2. J Chem Theory Comput. 2015. PMID: 25999804 Free PMC article.
-
A new force field (ECEPP-05) for peptides, proteins, and organic molecules.J Phys Chem B. 2006 Mar 16;110(10):5025-44. doi: 10.1021/jp054994x. J Phys Chem B. 2006. PMID: 16526746
-
Tri-peptide reference structures for the calculation of relative solvent accessible surface area in protein amino acid residues.Comput Biol Chem. 2015 Feb;54:33-43. doi: 10.1016/j.compbiolchem.2014.11.007. Epub 2014 Dec 3. Comput Biol Chem. 2015. PMID: 25544680
-
Force field development phase II: Relaxation of physics-based criteria… or inclusion of more rigorous physics into the representation of molecular energetics.J Comput Aided Mol Des. 2019 Feb;33(2):205-264. doi: 10.1007/s10822-018-0134-x. Epub 2018 Nov 30. J Comput Aided Mol Des. 2019. PMID: 30506159 Review.
-
Biomolecular force fields: where have we been, where are we now, where do we need to go and how do we get there?J Comput Aided Mol Des. 2019 Feb;33(2):133-203. doi: 10.1007/s10822-018-0111-4. Epub 2018 Nov 30. J Comput Aided Mol Des. 2019. PMID: 30506158 Review.
Cited by
-
Molecular Docking and Dynamic Simulation Revealed the Potential Inhibitory Activity of Opioid Compounds Targeting the Main Protease of SARS-CoV-2.Biomed Res Int. 2022 Dec 21;2022:1672031. doi: 10.1155/2022/1672031. eCollection 2022. Biomed Res Int. 2022. PMID: 36588530 Free PMC article.
-
Micro-Environmental Signature of The Interactions between Druggable Target Protein, Dipeptidyl Peptidase-IV, and Anti-Diabetic Drugs.Cell J. 2017 Apr-Jun;19(1):65-83. doi: 10.22074/cellj.2016.4865. Epub 2016 Dec 21. Cell J. 2017. PMID: 28367418 Free PMC article.
-
Predicting flexible loop regions that interact with ligands: the challenge of accurate scoring.Proteins. 2012 Jan;80(1):246-60. doi: 10.1002/prot.23199. Epub 2011 Nov 9. Proteins. 2012. PMID: 22072600 Free PMC article.
-
Lapatinib-binding protein kinases in the African trypanosome: identification of cellular targets for kinase-directed chemical scaffolds.PLoS One. 2013;8(2):e56150. doi: 10.1371/journal.pone.0056150. Epub 2013 Feb 20. PLoS One. 2013. PMID: 23437089 Free PMC article.
-
Evaluation of the Binding Relationship of the RdRp Enzyme to Novel Thiazole/Acid Hydrazone Hybrids Obtainable through Green Synthetic Procedure.Polymers (Basel). 2022 Aug 3;14(15):3160. doi: 10.3390/polym14153160. Polymers (Basel). 2022. PMID: 35956675 Free PMC article.
References
-
- Chothia C, Lesk AM. Canonical structures for the hypervariable regions of immunoglobulins. J Mol Biol. 1987;196(4):901–917. - PubMed
-
- Chothia C, Lesk AM, Tramontano A, Levitt M, Smith-Gill SJ, Air G, Sheriff S, Padlan EA, Davies D, Tulip WR, et al. Conformations of immunoglobulin hypervariable regions. Nature. 1989;342(6252):877–883. - PubMed
-
- Zhu K, Pincus DL, Zhao S, Friesner RA. Long loop prediction using the protein local optimization program. Proteins. 2006;65(2):438–452. - PubMed
Publication types
MeSH terms
Substances
Grants and funding
LinkOut - more resources
Full Text Sources
