. 2012 Feb;22(2):209-21.
doi: 10.1002/hipo.20884. Epub 2010 Nov 10.

A novel non-CB1/TRPV1 endocannabinoid-mediated mechanism depresses excitatory synapses on hippocampal CA1 interneurons

Affiliations

A novel non-CB1/TRPV1 endocannabinoid-mediated mechanism depresses excitatory synapses on hippocampal CA1 interneurons

Jeffrey G Edwards et al. Hippocampus. 2012 Feb.

Abstract

Endocannabinoids (eCBs) mediate various forms of synaptic plasticity at excitatory and inhibitory synapses in the brain. The eCB anandamide binds to several receptors including the transient receptor potential vanilloid 1 (TRPV1) and cannabinoid receptor 1 (CB1). We recently identified that TRPV1 is required for long-term depression at excitatory synapses on CA1 hippocampal stratum radiatum interneurons. Here we performed whole-cell patch clamp recordings from CA1 stratum radiatum interneurons in rat brain slices to investigate the effect of the eCB anandamide on excitatory synapses as well as the involvement of Group I metabotropic glutamate receptors (mGluRs), which have been reported to produce eCBs endogenously. Application of the nonhydrolysable anandamide analog R-methanandamide depressed excitatory transmission to CA1 stratum radiatum interneurons by ∼50%. The Group I mGluR agonist DHPG also depressed excitatory glutamatergic transmission onto interneurons to a similar degree, and this depression was blocked by the mGluR5 antagonist MPEP (10 μM) but not by the mGluR1 antagonist CPCCOEt (50 μM). Interestingly, however, neither DHPG-mediated nor R-methanandamide-mediated depression was blocked by the TRPV1 antagonist capsazepine (10 μM), the CB1 antagonist AM-251 (2 μM) or a combination of both, suggesting the presence of a novel eCB receptor or anandamide target at excitatory hippocampal synapses. DHPG also occluded R-methanandamide depression, suggesting the possibility that the two drugs elicit synaptic depression via a shared signaling mechanism. Collectively, this study illustrates a novel CB1/TRPV1-independent eCB pathway present in the hippocampus that mediates depression at excitatory synapses on CA1 stratum radiatum interneurons.


Figures

Figure 1
Figure 1
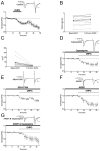
The endocannabinoid analogue, R-methanandamide, mediates depression of excitatory post synaptic currents (EPSCs) on CA1 stratum radiatum interneurons. A: application of R-methanandamide (50 μM) induces significant (P < 0.05) depression (EPSC amplitudes after 10–15 minutes in R-methanandamide: 55.3 ± 13.4% of pre-drug control values, n = 14) of EPSCs. B: R-methanandamide (50 μM) did not induce a significant (P > 0.7) depression of excitatory postsynaptic potentials (EPSPs) recorded from CA1 stratum radiatum field recordings (EPSP amplitudes after 10–15 minutes in R-methanandamide were 98.6% ± 7.8% of baseline, n=5;) that were used to measure the effect of R-methanandamide on CA1 pyramidal cells. C: application of R-methanandamide induced a significant (P < 0.05; *) increase in paired pulse ratio (PPR; ratio was 0.8 ± 0.1 before R-methanandamide application and 1.0 ± 0.2 after, a 19% increase), suggesting a presynaptic site for its action. D: application of R-methanandamide also induced a significant (P < 0.01; **) decrease in coefficient of variance (1/CV2). Non-normalized values of PPR and 1/CV2 from each interneuron are shown (open circles). The thick black line and filled circles indicate the mean value for all cells. In individual experiments the PPR significantly increased in 8 of 13 cells. See methods for a detailed description of 1/CV2 and PPR determination. Error bars indicate SEM. Scale bars: A, 100 pA, 10 ms; B, 0.1 mV, 10 ms.
Figure 2
Figure 2
R-methanandamide-induced depression is not dependent on cannabinoid receptor 1 (CB1) or transient receptor potential vanilloid 1 (TRPV1) receptor activation. R-methanandamide-induced depression is not blocked by pre-exposure to either A, the TRPV1 specific antagonist capsazepine (10 μM; EPSC amplitudes after 10–15 minutes in R-methanandamide and capsazepine: 54.6 ± 8.6% of pre-R-methanandamide control values, n = 6; P = 0.97 compared to R-methanandamide depression in the absence of capsazepine), B, the CB1/TRPV1 antagonist SR141716A (1 μM; EPSC amplitudes after 10–15 minutes in R-methanandamide and SR141716A: 37.3 ± 12.1% of pre-R-methanandamide control values, n = 5; P = 0.35 compared to R-methanandamide depression in the absence of SR141716A), C, the CB1 specific antagonist AM-251 (2 μM; EPSC amplitudes after 10–15 minutes in R-methanandamide and AM251: 51.1 ± 4.1% of pre-R-methanandamide control values, n = 5; P = 0.76 compared to R-methanandamide depression in the absence of AM251), or D, a combination of AM-251 and capsazepine (EPSC amplitudes after 10–15 minutes in R-methanandamide and AM251 plus capsazepine: 33.7 ± 7.7% of pre-R-methanandamide control values, n = 6; P = 0.20 compared to R-methanandamide depression in the absence of AM251 plus capsazepine). Error bars indicate SEM. Insets: representative paired pulse EPSCs (average of 10 consecutive) before (black) and after drug application (gray). Scale bar: 100 pA, 10 ms.
Figure 3
Figure 3
DHPG-mediated depression of excitatory synapses on CA1 stratum radiatum interneurons has a similar pharmacological profile to that of R-methanandamide. A: DHPG (50–100 μM) depresses EPSCs recorded from interneurons (62.5 ± 8.7% of pre-drug control values; P < 0.001, n = 17), which lasts beyond the time of drug application (n = 16). B & C: PPRs were increased (ratio was 1.2 ± 0.1 before R-methanandamide application and 1.3 ± 0.1 after, a 5% increase) and CVs were significantly decreased (P < 0.05) in DHPG. Non-normalized values of PPR (B) and 1/CV2 (C) from each interneuron are shown (open circles). The thick black line and filled circles indicate the mean value for all cells. In individual experiments the PPR significantly increased in 9 of 13 cells. DHPG-induced LTD is not blocked by pre-exposure to either D, the TRPV1 specific antagonist capsazepine (10 μM; EPSC amplitudes after 10–15 minutes in DHPG and in the presence of capsazepine: 58.3 ± 11.6% of pre-DHPG control values, n = 5; P = 0.82 compared to DHPG depression in the absence of capsazepine), E, the CB1/TRPV1 antagonist SR141716A (1 μM; EPSC amplitudes after 10–15 minutes in DHPG and SR141716A: 62.3 ± 7.8% of pre-DHPG control values, n = 8; P = 0.99 compared to DHPG depression in the absence of SR141716A), F, the CB1 specific antagonist AM251 (2 μM; EPSC amplitudes after 10–15 minutes in DHPG and AM251: 32.0 ± 11.9% of pre-DHPG control values, n = 5; P = 0.11 compared to DHPG depression in the absence of AM251), or G, a combination of AM251 and capsazepine (EPSC amplitudes after 10–15 minutes in DHPG and AM251 plus capsazepine: 47.0 ± 16.6% of pre-DHPG control values, n = 5; P = 0.42 compared to DHPG depression in the absence of AM251 plus capsazepine). Note that cell to cell differences in the degree of DHPG-induced depression can be seen as differences in overall depression in each of these experiments; however DHPG depresses all cells to some degree, which is never blocked by these antagonists. Error bars indicate SEM. Insets: representative paired pulse EPSCs (average of 10 consecutive) before (black) and after drug application (gray). Scale bar: 100 pA, 10 ms.
Figure 4
Figure 4
The effects of DHPG are mediated by mGluR5 and occlude synaptic depression by R-methanandamide. A: DHPG (50 μM) continues to induce LTD even during pre-exposure to the mGluR1 antagonist CPCCOEt (50 μM; EPSC amplitudes after 10–15 minutes in DHPG and CPCCOEt: 52.7 ± 9.7% of pre-DHPG control values, n = 8; P = 0.51 compared to DHPG depression in the absence of CPCCOEt). B: in contrast, DHPG does not induce LTD during pre-exposure of the mGluR5 antagonist MPEP (10 μM; EPSC amplitudes after 10–15 minutes in DHPG and MPEP: 97.8 ± 13.1% of pre-DHPG control values, n = 7; P < 0.05 compared to DHPG depression in the absence of MPEP). C: pre-exposure of DHPG for at least 15 minutes occludes R-methanandamide mediated depression (EPSC amplitudes after 10–15 minutes in R-methanandamide: 108.5 ± 22.0% of pre-drug control values post-DHPG depression; P < 0.05 compared to control R-methanandamide depression, n = 8). Error bars indicate SEM. Insets: representative paired pulse EPSCs (average of 10 consecutive) before (black) and after drug application (gray). Scale bar: 100 pA, 10 ms.
Figure 5
Figure 5
Intracellular application of GDPβS inhibits long lasting depression mediate by DHPG. A) Short-term application of R-methanandamide in the presence and absence of internal GDPβS (n=8; n= 5 with GDPβS and n=3 without; data were combined because there was no statistical or visual difference between the two groups) resulted in a significant (P < 0.05) long lasting depression. The depression of combined (with and without GDPβS) or separated data, at 10–15 post R-methanandamide application were not significantly different (P > 0.5) from R-methanandamide application in Fig. 1A where no washout effect was investigated. Error bars indicate SEM. Insets: representative paired pulse EPSCs (average of 15 consecutive) before (black) and during R-methanandamide application (light gray) in the presence of GDPβS. Scale bar: 50 pA, 10 ms. B) Acute depression mediated by DHPG is not significantly different (P > 0.7) in the presence of GDPβS as compared to in its absence (see Fig. 3A). However, in the presence of GDPβS, DHPG-mediated long-term depression as measured using EPSCs 25–30 minutes after washout, were significantly greater (P < 0.05) as compared to DHPG in the absence of GDPβS, indicating a significant washout effect. Error bars indicate SEM. Insets: representative paired pulse EPSCs (average of 15 consecutive) before (black), after DHPG application (light gray) and after washout (dark gray) in the presence of GDPβS. Scale bar: 50 pA, 10 ms.
Figure 6
Figure 6
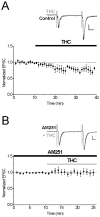
THC mediates depression of interneuron EPSCs via CB1 receptors. A: application of THC (1 μM) induces significant depression of EPSCs (EPSC amplitudes after 10–15 minutes in THC: 80.3 ± 9.0% of pre-drug control values; P < 0.05, n = 13). B: THC-mediated depression is blocked by pre-exposure to AM-251 (2 μM; EPSC amplitudes after 10–15 minutes in THC and AM251: 100.3 ± 9.0% of pre-THC control values, n = 7; P < 0.05 compared to THC depression in the absence of AM251). Error bars indicate SEM. Insets: representative paired pulse EPSCs (average of 10 consecutive) before (black) and after drug application (gray). Scale bar: 100 pA, 10 ms.

Similar articles

Cited by

References

    1. Al-Hayani A, Wease KN, Ross RA, Pertwee RG, Davies SN. The endogenous cannabinoid anandamide activates vanilloid receptors in the rat hippocampal slice. Neuropharmacology. 2001;41(8):1000–1005. - PubMed
    1. Ameri A. The effects of cannabinoids on the brain. Progress in Neurobiology. 1999;58(4):315–348. - PubMed
    1. Ameri A, Wilhelm A, Simmet T. Effects of the endogeneous cannabinoid, anandamide, on neuronal activity in rat hippocampal slices. Br J Pharmacol. 1999;126(8):1831–1839. - PMC - PubMed
    1. Auclair N, Otani S, Soubrie P, Crepel F. Cannabinoids Modulate Synaptic Strength and Plasticity at Glutamatergic Synapses of Rat Prefrontal Cortex Pyramidal Neurons. J Neurophysiol. 2000;83(6):3287–3293. - PubMed
    1. Bliss TVP, Lomo T. Long-lasting potentiation of synaptic transmission in the dentate area of the anaesthetized rabbit following stimulation of the perforant path. J Physiol. 1973;232(2):331–356. - PMC - PubMed

Publication types

MeSH terms