. 2010 Nov 11:5:51.
doi: 10.1186/1750-1326-5-51.

Age-dependent changes in TDP-43 levels in a mouse model of Alzheimer disease are linked to Aβ oligomers accumulation

Affiliations

Age-dependent changes in TDP-43 levels in a mouse model of Alzheimer disease are linked to Aβ oligomers accumulation

Antonella Caccamo et al. Mol Neurodegener. .

Abstract

Background: Transactive response DNA-binding protein 43 (TDP-43) is the pathological protein found in frontotemporal lobar degeneration with ubiquitin positive inclusions and in amyotrophic lateral sclerosis. In diseased tissue, TDP-43 translocates from its physiological nuclear location into the cytoplasm, where it accumulates. Additionally, C-terminal fragments of TDP-43 accumulate in affected brain regions and are sufficient to cause TDP-43 mislocalization and cytoplasmic accumulation in vitro. TDP-43 also accumulates in 30% of Alzheimer disease (AD) cases, a finding that has been highly reproducible. The role of TDP-43 in AD and its relation with Aβ and tau pathology, the two neuropathological hallmarks of AD, remains to be elucidated.

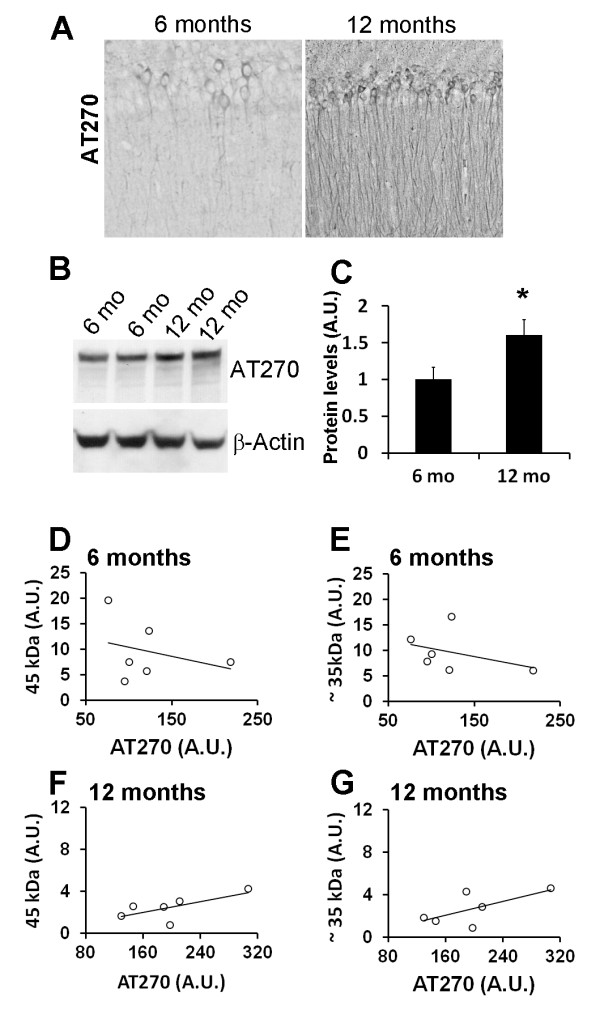
Results: Here we show that levels of TDP-43 and its ~35 kDa C-terminal fragment are significantly increased in the 3×Tg-AD mice, an animal model of AD that develops an age-dependent cognitive decline linked to the accumulation of Aβ and tau. We also report that the levels of TDP-43 and its C-terminal fragment correlate with the levels of soluble Aβ oligomers, which play a key role in AD pathogenesis. Notably, genetically reducing Aβ42 production restores the levels of TDP-43 and its ~35 kDa C-terminal fragment to control levels.

Conclusions: These data suggest a possible relation between Aβ oligomers and TDP-43.


Figures

Figure 1
Figure 1
3×Tg-AD mice have higher levels of TDP-43 and TDP-35. (A) Representative Western blots of proteins from the low salt fraction extracted from 2-month-old 3×Tg-AD and NonTg mice and probed with the indicated antibodies. A longer exposure time was necessary to see the less abundant low molecular weight fragments. (B) Quantitative analysis of the blots shows that at 2 months of age the levels of TDP-43 and TDP-35 were similar between 3×Tg-AD and NonTg mice (n = 6/genotype). (C) Representative Western blots of proteins from the low salt fraction extracted from 6-month-old 3×Tg-AD and NonTg mice. (D) Quantitative analysis of the blots shows that at 6 months of age the levels of TDP-43 and TDP-35 were significantly increased (p = 0.04 and p = 0.01, respectively) in the brains of the 3×Tg-AD mice compared to age- and gender-matched NonTg mice (n = 6/genotype). (E) Representative Western blots of proteins from the low salt fraction extracted from 12-month-old 3×Tg-AD and NonTg mice (n = 6/genotype). (F) Quantitative analysis of the blots shows that at 12 months of age the levels of TDP-43 and TDP-35 were similar between 3×Tg-AD and NonTg mice (n = 6/genotype). Abbreviation: exp = exposure. Data are presented as ± SEM and analyzed by t-test analysis.
Figure 2
Figure 2
Age-dependent changes in TDP-43 and TDP-35 levels. (A) Representative Western blots of proteins from the low salt fraction extracted from 2-, 6- and 12-month-old NonTg mice and probed with a polyclonal antibody raised against TDP-43 antibody. A longer exposure time was necessary to see the less abundant low molecular weight fragments. (B) Quantitative analysis of the blots shows that the levels of TDP-43 and TDP-35 were similar across the three different ages analyzed (n = 6/time-point). (C) Representative Western blots of proteins from the low salt fraction extracted from 2-, 6- and 12-month-old 3×Tg-AD mice and probed with a polyclonal antibody raised against TDP-43 antibody. (B) Quantitative analysis of the blots shows that the levels of TDP-43 and TDP-35 were significantly higher at 6 months of age (n = 6/time-point). Abbreviation: exp = exposure. Data are presented as ± SEM and analyzed by one way ANOVA.
Figure 3
Figure 3
Age-dependent changes in TDP-43 and TDP-35 cellular localization. (A) Representative Western blots of proteins from the cytosolic and nuclear fractions extracted from 2-month-old NonTg and 3×Tg-AD mice and probed with the a polyclonal anti-TDP antibody. A longer exposure was necessary to see the less abundant low molecular weight fragments. (B-C) Quantitative analysis of the blots shows that at 2 months of age the nuclear and cytosolic levels of TDP-43 and TDP-35 were not statistically significant between 3×Tg-AD and NonTg mice (n = 6/genotype). (D) Representative Western blots of proteins from the cytosolic and nuclear fractions extracted from 6-month-old NonTg and 3×Tg-AD mice and probed with a polyclonal anti-TDP antibody. (E-F) Quantitative analysis of the blots shows that at 6 months of age the nuclear levels of TDP-43 and TDP-35 were not statistically significant between 3×Tg-AD and NonTg mice (n = 6/genotype). In contrast, the cytosolic levels of TDP-43 and TDP-35 were significantly higher in the 3×Tg-AD mice compared to NonTg mice (p = 0.03 and p = 0.01, respectively). (G) Representative Western blots of proteins from the cytosolic and nuclear fractions extracted from 12-month-old NonTg and 3×Tg-AD mice and probed with a polyclonal anti-TDP antibody. (H-I) Quantitative analysis of the blots shows that at 12 months of age the nuclear and cytosolic levels of TDP-43 and TDP-35 were not statistically significant between 3×Tg-AD and NonTg mice (n = 6/genotype). Abbreviation: exp = exposure. Data are presented as ± SEM and analyzed by t-test analysis.
Figure 4
Figure 4
TDP-43 and TDP-35 levels do not correlate with tau phosphorylated at Thr181. (A) Representative microphotographs of 3×Tg-AD brain sections depicting hippocampal CA1 pyramidal neurons stained with the anti-tau antibody AT270, which recognize tau phosphorylated at Thr181 (n = 6/age group). (B) Representative Western blots of proteins extracted from 6- and 12-month old 3×Tg-AD mice probed with the AT270 antibody. β-actin is used as a loading control. (C) Quantitative analysis of the blots shows that the steady-state levels of AT270 were significantly higher in the brains of 12-month-old 3×Tg-AD mice compared to 6-month-old mice (n = 6/age group; p < 0.05). Data are presented as ± SEM and analyzed by t-test analysis. (D-E) Linear regression analysis indicated that the levels of AT270 in the brains of 6-month-old 3×Tg-AD mice did not correlate with the levels of TDP-43 (r2 = 0.09148, p = 0.56) and TDP-35 (r2 = 0.1491, p = 0.45). (F-G) Similarly, no correlation between AT270 and TDP-43 (r2 = 0.4644, p = 0.14) and TDP-35 (r2 = 0.4469, p = 0.15) levels was observed at 12 months of age.
Figure 5
Figure 5
Aβ oligomers correlate with TDP-43 and TDP-35. (A-D) Representative microphotographs showing 3×Tg-AD hippocampal sections stained with the antibody M71/3, which is specific for Aβ oligomers. Panels C and D show higher magnification views of panels A and B, respectively (n = 6/age group). (E) Representative dot blots of protein extracted from 2-, 6-, and 12-month-old 3×Tg-AD mice and probed with the antibody A11, which is specific for Aβ oligomers. (F) Quantitative analysis of the dot blots shows that at 6 months of age, A11 levels were significantly higher compared to 2-month-old mice (p < 0.001) and 12-month-old mice (p < 0.05). (G-H) Linear regression analysis indicated that the levels of A11 in the brains of 6-month-old 3×Tg-AD mice significantly correlated with the levels of TDP-43 (r2 = 0.9330, p = 0.001) and TDP-35 (r2 = 0.6749, p = 0.045). (I) Similarly, the levels of A11 in the brains of 12-month-old 3×Tg-AD mice significantly correlated with TDP-43 (r2 = 0.7259, p = 0.031). (J) A strong trend was observed when analyzing A11 and TDP-35 levels in 12-month-old 3×Tg-AD mice (r2 = 0.6277, p = 0.06). The dotted lines in panels G-J represent 95% confidence intervals.
Figure 6
Figure 6
Reduction of Aβ42 levels decreases TDP-43 and TDP-35 levels. (A-B) Representative microphotographs depicting CA1 pyramidal neurons from 6-month-old 3×Tg-AD and APP/tau mice stained with an anti-Aβ antibody (n = 6/group). (C) Representative microphotograph depicting CA1 pyramidal neurons from APP/tau mice stained with the anti-oligomeric antibody M17/3. (D) Representative Western blots of protein extracted from the brains of 6-month-old NonTg, APP/tau and 3×Tg-AD mice (low salt fraction), probed with a polyclonal anti-TDP-43 antibody. β-Actin is used as a loading control. A longer exposure time was necessary to see the less abundant low molecular weight fragments. (E-F) Quantitative analysis of the blots (n = 6/genotype) shows that in APP/tau mice, the steady-state levels of TDP-43 and TDP-35 are significantly lower in APP/tau mice compared to 3×Tg-AD mice (p < 0.05). The levels of TDP-43 and TDP-35 were not statistically significant different between APP/tau and NonTg mice. Data are presented as means ± SEM and were analyzed using one-way ANOVA following by post hoc Bonferroni test to determine individual differences in groups. Abbreviation: exp = exposure.

References

    1. Ferri CP, Prince M, Brayne C, Brodaty H, Fratiglioni L, Ganguli M, Hall K, Hasegawa K, Hendrie H, Huang Y. et al. Global prevalence of dementia: a Delphi consensus study. Lancet. 2005;366:2112–2117. doi: 10.1016/S0140-6736(05)67889-0. - DOI - PMC - PubMed
    1. Artero S, Tierney MC, Touchon J, Ritchie K. Prediction of transition from cognitive impairment to senile dementia: a prospective, longitudinal study. Acta psychiatrica Scandinavica. 2003;107:390–393. doi: 10.1034/j.1600-0447.2003.00081.x. - DOI - PubMed
    1. Lambon Ralph MA, Patterson K, Graham N, Dawson K, Hodges JR. Homogeneity and heterogeneity in mild cognitive impairment and Alzheimer's disease: a cross-sectional and longitudinal study of 55 cases. Brain. 2003;126:2350–2362. doi: 10.1093/brain/awg236. - DOI - PubMed
    1. Welsh KA, Butters N, Hughes JP, Mohs RC, Heyman A. Detection and staging of dementia in Alzheimer's disease. Use of the neuropsychological measures developed for the Consortium to Establish a Registry for Alzheimer's Disease. Archives of neurology. 1992;49:448–452. - PubMed
    1. Selkoe DJ. Alzheimer's disease: genes, proteins, and therapy. Physiological reviews. 2001;81:741–766. - PubMed

LinkOut - more resources