. 2010 Nov 11:11:629.
doi: 10.1186/1471-2164-11-629.

Differential gene expression in nearly isogenic lines with QTL for partial resistance to Puccinia hordei in barley

Affiliations

Differential gene expression in nearly isogenic lines with QTL for partial resistance to Puccinia hordei in barley

Xinwei Chen et al. BMC Genomics. .

Abstract

Background: The barley-Puccinia hordei (barley leaf rust) pathosystem is a model for investigating partial disease resistance in crop plants and genetic mapping of phenotypic resistance has identified several quantitative trait loci (QTL) for partial resistance. Reciprocal QTL-specific near-isogenic lines (QTL-NILs) have been developed that combine two QTL, Rphq2 and Rphq3, the largest effects detected in a recombinant-inbred-line (RIL) population derived from a cross between the super-susceptible line L94 and partially-resistant line Vada. The molecular mechanism underpinning partial resistance in these QTL-NILs is unknown.

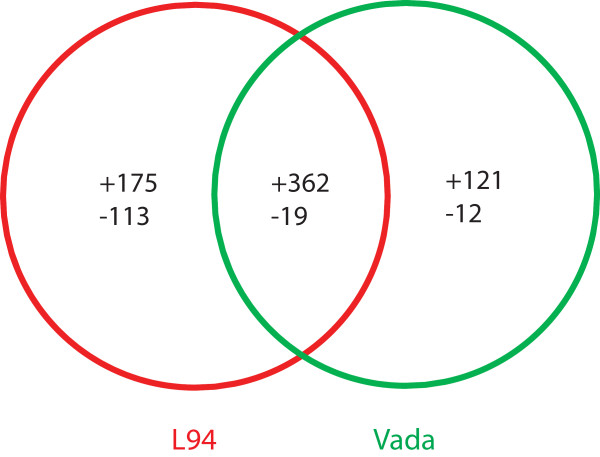
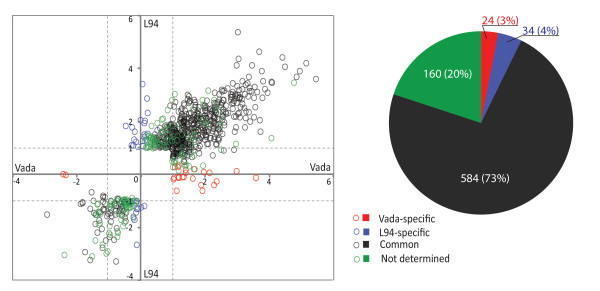
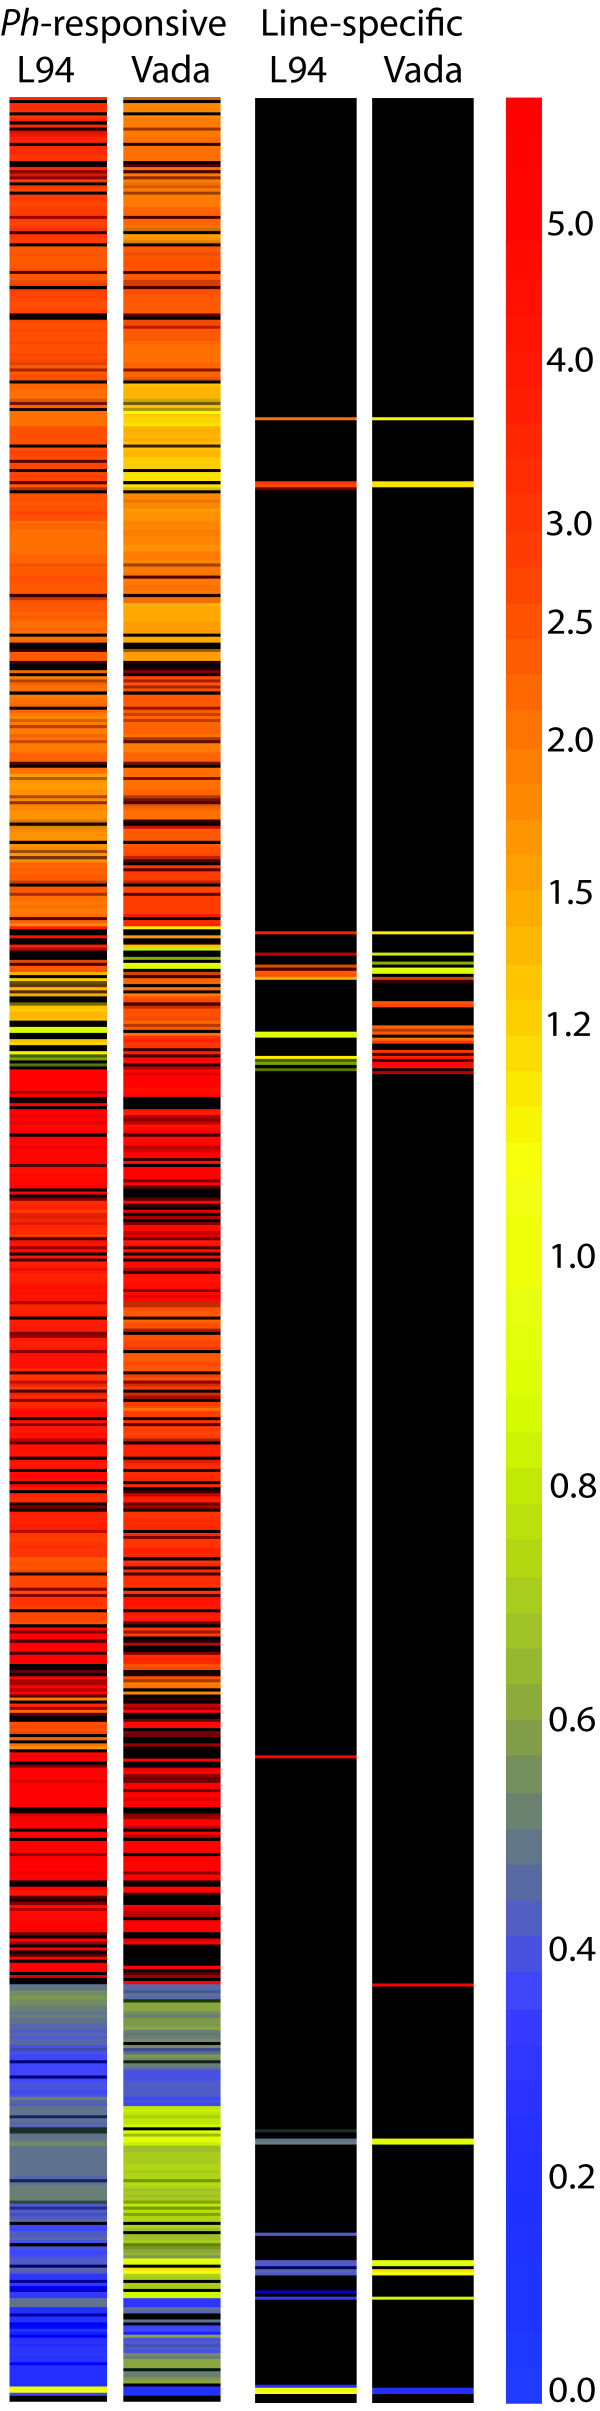
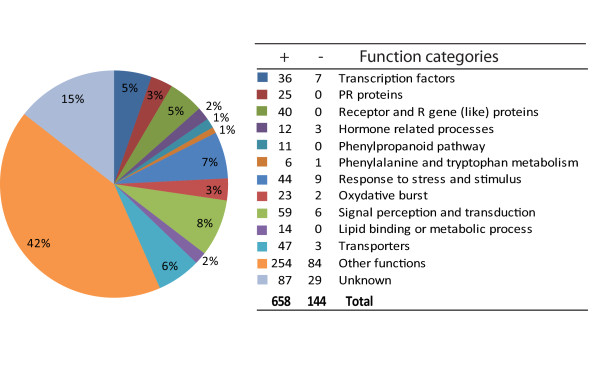
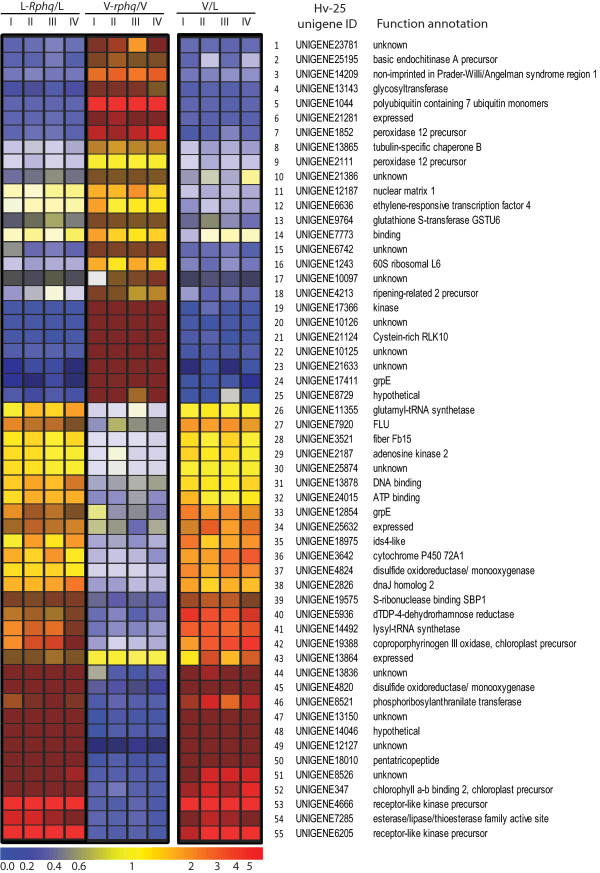
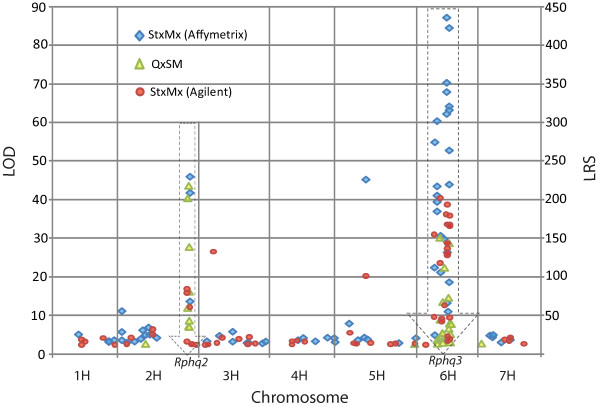
Results: An Agilent custom microarray consisting of 15,000 probes derived from barley consensus EST sequences was used to investigate genome-wide and QTL-specific differential expression of genes 18 hours post-inoculation (hpi) with Puccinia hordei. A total of 1,410 genes were identified as being significantly differentially expressed across the genome, of which 55 were accounted for by the genetic differences defined by QTL-NILs at Rphq2 and Rphq3. These genes were predominantly located at the QTL regions and are, therefore, positional candidates. One gene, encoding the transcriptional repressor Ethylene-Responsive Element Binding Factor 4 (HvERF4) was located outside the QTL at 71 cM on chromosome 1H, within a previously detected eQTL hotspot for defence response. The results indicate that Rphq2 or Rphq3 contains a trans-eQTL that modulates expression of HvERF4. We speculate that HvERF4 functions as an intermediate that conveys the response signal from a gene(s) contained within Rphq2 or Rphq3 to a host of down-stream defense responsive genes. Our results also reveal that barley lines with extreme or intermediate partial resistance phenotypes exhibit a profound similarity in their spectrum of Ph-responsive genes and that hormone-related signalling pathways are actively involved in response to Puccinia hordei.

Conclusions: Differential gene expression between QTL-NILs identifies genes predominantly located within the target region(s) providing both transcriptional and positional candidate genes for the QTL. Genetically mapping the differentially expressed genes relative to the QTL has the potential to discover trans-eQTL mediated regulatory relays initiated from genes within the QTL regions.


Figures

Figure 1
Figure 1
Venn diagram showing number of Ph-responsive genes (fold change >2, FDR <0.05) identified in L94 and Vada. '+' and '-' represent up- and down-regulation respectively.
Figure 2
Figure 2
Scatter plot of log ratios (ratio of signal intensity Ph-infected/Mock control) of the 802 Ph-responsive genes from Vada (horizontal axis) and L94 (vertical axis). Colour-coded circles represent genes in different groups with proportions shown in the pie chart. Log ratios >0 or <0 indicates up- or down-regulation respectively, dashed lines set at 1 and -1 corresponding to 2× fold change in expression.
Figure 3
Figure 3
A heat map illustrating expression patterns of the 802 Ph-responsive genes identified in L94 and Vada. Genes are organized by 'gene tree' hierarchical clustering implemented in GeneSpring based on overall similarity in expression patters (the gene tree has been omitted for clarity). The color bar indicates the expression ratios of the two treatments (Ph-infection vs. mock-inoculated controls). Red and blue represent up- and down-regulation respectively, whereas yellow represent no significant alteration. Left panel shows 802 genes that were significantly (FC >2, FDR <0.05) altered in at least one of the two lines; right panel shows the 58 line-specific genes that were only significantly (FC >2, FDR <0.05) altered in one line but not the other.
Figure 4
Figure 4
Functional classification of the 802 Ph-responsive genes. Number of up (+) or down (-) regulated genes are shown in the table (see Additional File 1, Table S1 for details).
Figure 5
Figure 5
Heat map of the genes significantly and differentially expressed in the three comparisons. 'L' and 'V' on top of the heat map refer to L94 and Vada respectively. Roman numerals represent the four biological replicates. Colour coding represents the transcript abundance ratios. The two comparisons involving NILs were performed on microarray slide 3 and showed reversed colouring reflecting the reciprocal features of the NILs in their genetic background. Comparison between the two parents was conducted on microarray slide 2 with transcript abundance being calculated as L94/Vada. The genes (rows) and treatment groups (columns) are clustered through gene tree generation by GeneSpring program on distance (gene tree has been omitted for clarity).
Figure 6
Figure 6
Distribution of the 163 eQTL detected from three experiments for the 52 genes (3 genes without eQTL detected) differentially expressed in QTL-specific NILs. Blue diamond, red dots and green triangles represent eQTL identified by Potokina et al. [22], Chen et al. [25] and Wise et al. (unpublished results) respectively. eQTL co-located with Rphq2 and Rphq3 were framed with dash-lined arrows. Significance levels of eQTL detected in the St/Mx population refer to LOD score, those with 'Q × SM' population refer to LRS.

Similar articles

Cited by

References

    1. Ausubel FM. Are innate immune signaling pathways in plants and animals conserved? Nature Immunology. 2005;6:973–79. doi: 10.1038/ni1253. - DOI - PubMed
    1. Nicaise V, Roux M, Zipfel C. Recent advances in PAMP-triggered immunity against bacteria: pattern recognition receptors watch over and raise the alarm. Plant Physiology. 2009;150:1638–1647. doi: 10.1104/pp.109.139709. - DOI - PMC - PubMed
    1. Bent AF, Mackey D. Elicitors, effectors, and R genes: the new paradigm and a lifetime supply of questions. Annual Review of Phytopathology. 2007;45:399–436. doi: 10.1146/annurev.phyto.45.062806.094427. - DOI - PubMed
    1. Bittel P, Robatzek S. Microbe-associated molecular patterns (MAMPs) probe plant immunity. Current Opinion in Plant Biology. 2007;10:335–341. doi: 10.1016/j.pbi.2007.04.021. - DOI - PubMed
    1. Niks RE, Marcel TC. Nonhost and basal resistance: how to explain specificity? New Phytologist. 2009;182:817–828. doi: 10.1111/j.1469-8137.2009.02849.x. - DOI - PubMed

Publication types