Review
. 2010 Nov;3(11):1181-95.
doi: 10.1016/j.jcmg.2010.09.009.

The year in molecular imaging

Affiliations
Review

The year in molecular imaging

Eric A Osborn et al. JACC Cardiovasc Imaging. 2010 Nov.

Abstract

Molecular imaging aims to enable personalized medicine via imaging-specific molecular and cellular targets that are relevant to the diagnosis and treatment of disease. By providing in vivo readouts of biological detail, molecular imaging complements traditional anatomical imaging modalities to allow: 1) visualization of important disease-modulating molecules and cells in vivo; 2) serial investigations to image evolutionary changes in disease attributes; and 3) evaluation of the in vivo molecular effects of biotherapeutics. The added information garnered by molecular imaging can improve risk assessment and prognosticative studies, this is of particular benefit in the management of cardiovascular disease (CVD).


Figures

Figure 1
Figure 1
PET/CT imaging of coronary arterial inflammation/metabolic activity via 18F-fluorodeoxyglucose (FDG). Suppression of myocardial FDG signal was obtained by using a special high-fat diet prior to imaging. Representative images of (A) 18F-FDG PET (B) cardiac CT axial slice (C) Fusion PET/CT image showing elevated 18FDG signal overlying a calcified coronary artery, and (D) correlative invasive coronary angiography showing severe LAD disease. Reproduced with permission from (7).
Figure 2
Figure 2
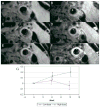
Molecular MRI of carotid plaque inflammation following high-dose statin treatment. Representative T2*-weighted left common carotid artery imaging pre- and post-USPIO administration at baseline (A and B), 6 weeks (C and D), and 12 weeks (E and F). (B) Baseline USPIO effect is present (signal loss on T2* weighted image, yellow arrowhead), indicating plaque macrophages. (C and E) Pre-USPIO signal is similar at each imaging timepoint, signifying loss of tissue retention before each round of imaging (red arrowhead). (D) Minimal USPIO signal loss is observed by 6 weeks (blue arrowhead), consistent with reduced plaque inflammation (F) At 12 weeks, even less USPIO effect is present (blue arrowheads). (G) Signal intensity change (ΔSI) compared for the 2 treatment groups at baseline, 6, and 12 weeks with 95% confidence intervals; low-dose (red line) and high-dose (dashed blue line, showing less USPIO effect and thus higher signal). Reproduced with permission from (8).
Figure 3
Figure 3
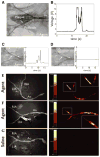
Real-time intravascular NIR fluorescence detection of atherosclerosis inflammation. (A) In vivo manual catheter pullback trajectory in the iliac arteries (dotted arrow). (B and C) Rabbits injected with a protease-activatable NIRF agent showed strong fluorescence signals in vivo, through blood, without flushing (Prosense750 group, average TBR 6.8) in angiographically-demarcated iliac plaques. (D) Saline-injected rabbits generated significantly less NIRF signal. (E, F) Paired light and NIRF signals in ex vivo arterial samples show enhanced NIRF protease activity. (G) Saline-injected control rabbits again with minimal plaque autofluorescence. RIA, right iliac artery; LIA, left iliac artery; Ao, aorta. Reproduced with permission from (26).
Figure 4
Figure 4
Molecular MRI of fibrin-rich thrombi using the clinical agent EP-2104R. (A) Right atrial thrombus is demonstrated in the right panel 24 hrs after EP-2104R delivery with peripheral hyperenhancement. In addition EP-2104R enhanced fibrin-bearing irregular aortic atheromata, and fibrinous pleuritis of the right lung. (B) Prior to EP-2104R injection in the left panel, an initially hidden left ventricular thrombus becomes apparent two hours after EP-2104R administration (center panel) and persists 24 hours later (right panel). Reproduced with permission from (31).
Figure 5
Figure 5
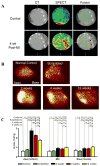
In vivo molecular imaging of myocardial remodeling via 99mtechnetium-labeled Cy5.5-RGD peptide (Tc-CRIP). (A) Micro-CT, microSPECT, and SPECT/CT fusion images in control mice (top row) or mice 4 weeks after anterior MI (bottom row) demonstrate Tc-CRIP uptake exclusively in infarcted mice. Explanted hearts from (B) controls had no significant Tc-CRIP uptake, however intense Tc-CRIP signal was present in infarcted mice 2 weeks after MI that then diminished at 4 and 12 weeks. (C) Quantitative Tc-CRIP activity was greatest in the apical infarct, followed by the mid peri-infarct zone and non-infarcted base. Reproduced with permission from (36).
Figure 6
Figure 6
Reporter gene optical imaging of cardiac stem cell (CSC) transplantation. (A) Firefly luciferase reporter gene labeled CSC transplantation reveals prominent bioluminescence signal at day 2 that decreased markedly over 8 weeks of longitudinal tracking. (B and C) Quantitative analyses of transplanted CSC signal changes over time and % donor cell survival. Reproduced with permission from (41).
Figure 7
Figure 7
Combined reporter gene imaging (NIS-PET) and physical cell labeling (iron oxide-MRI) of cell transplantation. (A) Short-axis imaging of transplanted iron oxide (SPIOs) and NIS (sodium iodide symporter) reporter gene labeled EPCs into rat hearts at days 1, 3, and 7. (B) Mean (±SD) SPIO/MRI signals were stable over 7 days, while 124I PET uptake rapidly diminished to undetectable levels at day 7 (*P < 0.001). (C and D) Autoradiography revealed similar loss of 124I uptake over time, present as early as day 3 (*p<0.001). This study highlights the differences between reporter gene and physical cell label approaches for cell tracking. Reproduced with permission from (45).

Similar articles

Cited by

References

    1. Rominger A, Saam T, Wolpers S, et al. 18F-FDG PET/CT identifies patients at risk for future vascular events in an otherwise asymptomatic cohort with neoplastic disease. J Nucl Med. 2009;50:1611–20. - PubMed
    1. Wassélius J, Larsson S, Sundin A, Jacobsson H. Assessment of inactive, active and mixed atherosclerotic plaques by 18F-FDG-PET; an age group-based correlation with cardiovascular risk factors. The international journal of cardiovascular imaging. 2009;25:133–40. - PubMed
    1. Rudd JHF, Myers KS, Bansilal S, et al. Relationships Among Regional Arterial Inflammation, Calcification, Risk Factors, and Biomarkers: A Prospective Fluorodeoxyglucose Positron-Emission Tomography/Computed Tomography Imaging Study. Circulation: Cardiovascular Imaging. 2009;2:107–115. - PMC - PubMed
    1. Silvera SS, Aidi He, Rudd JHF, et al. Multimodality imaging of atherosclerotic plaque activity and composition using FDG-PET/CT and MRI in carotid and femoral arteries. Atherosclerosis. 2009;207:139–43. - PMC - PubMed
    1. Kwee RM, Teule GJJ, van Oostenbrugge RJ, et al. Multimodality imaging of carotid artery plaques: 18F-fluoro-2-deoxyglucose positron emission tomography, computed tomography, and magnetic resonance imaging. Stroke. 2009;40:3718–24. - PubMed

Publication types