

NMR-spectroscopic analysis of mixtures: from structure to function
- PMID: 21071261
- PMCID: PMC3053045
- DOI: 10.1016/j.cbpa.2010.10.010
NMR-spectroscopic analysis of mixtures: from structure to function
Abstract
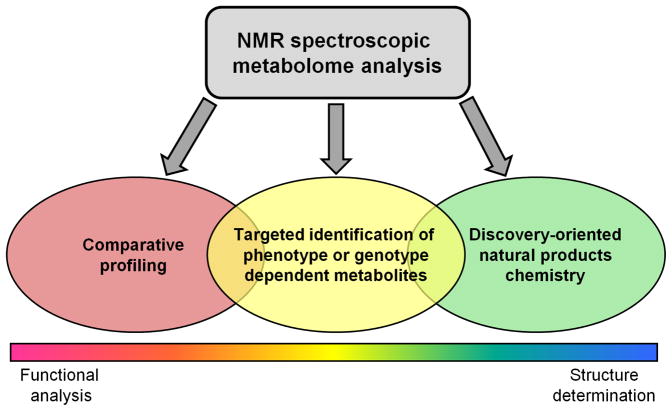
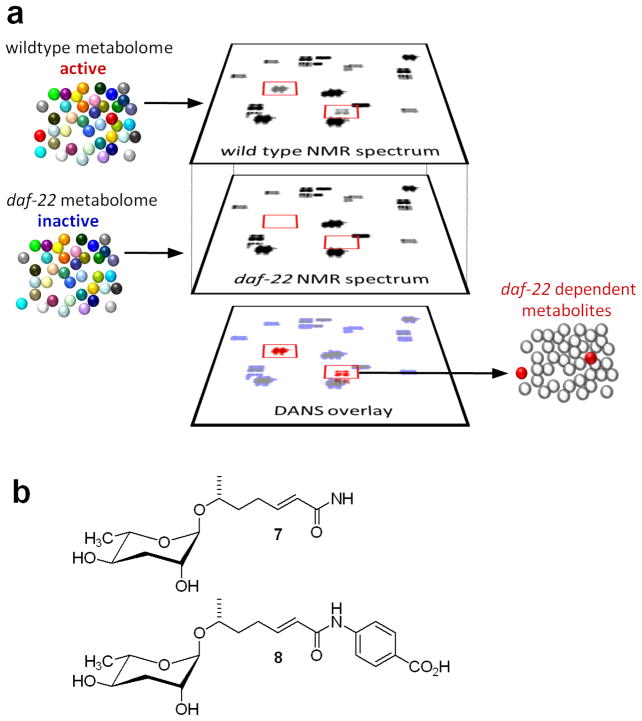
NMR spectroscopy as a particularly information-rich method offers unique opportunities for improving the structural and functional characterization of metabolomes, which will be essential for advancing the understanding of many biological processes. Whereas traditionally NMR spectroscopy was mostly relegated to the characterization of pure compounds, the past few years have seen a surge of interest in using NMR-spectroscopic techniques for characterizing complex metabolite mixtures. Development of new methods was motivated partly by the realization that using NMR for the analysis of metabolite mixtures can help identify otherwise inaccessible small molecules, for example compounds that are prone to chemical decomposition and thus cannot be isolated. Furthermore, comparative metabolomics and statistical analyses of NMR spectra have proven highly effective at identifying novel and known metabolites that correlate with changes in genotype or phenotype. In this review, we provide an overview of the range of NMR-spectroscopic techniques recently developed for characterizing metabolite mixtures, including methods used in discovery-oriented natural product chemistry, in the study of metabolite biosynthesis and function, or for comparative analyses of entire metabolomes.
Copyright © 2010 Elsevier Ltd. All rights reserved.
Figures
References
-
- Edison AS, Schroeder FC, Lew M, Hung-Wen L. Comprehensive Natural Products II. Elsevier; NMR - Small Molecules and Analysis of Complex Mixtures; pp. 169–196.
-
- Nicholson JK, Lindon JC. Systems biology: Metabonomics. Nature. 2008;455:1054–1056. - PubMed
-
- MacBeath G, Saghatelian A. The promise and challenge of [′]-omic' approaches. Current Opinion in Chemical Biology. 2009;13:501–502. - PubMed
-
- Beckonert O, Keun HC, Ebbels TM, Bundy J, Holmes E, Lindon JC, Nicholson JK. Metabolic profiling, metabolomic and metabonomic procedures for NMR spectroscopy of urine, plasma, serum and tissue extracts. Nat Protoc. 2007;2 :2692–2703. - PubMed
-
- Bross-Walch N, Kuhn T, Moskau D, Zerbe O. Strategies and tools for structure determination of natural products using modern methods of NMR spectroscopy. Chem Biodivers. 2005;2:147–177. - PubMed
Publication types
MeSH terms
Grants and funding
LinkOut - more resources
Full Text Sources
Other Literature Sources
Miscellaneous
