. 2011 Feb;96(2):204-12.
doi: 10.3324/haematol.2010.029082. Epub 2010 Nov 11.

Glucose availability in hypoxia regulates the selection of chronic myeloid leukemia progenitor subsets with different resistance to imatinib-mesylate

Affiliations

Glucose availability in hypoxia regulates the selection of chronic myeloid leukemia progenitor subsets with different resistance to imatinib-mesylate

Serena Giuntoli et al. Haematologica. 2011 Feb.

Abstract

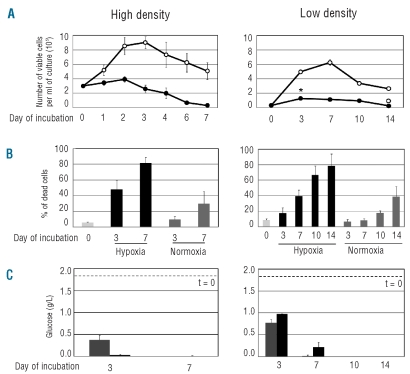
Background: Incubation of chronic myeloid leukemia cells in hypoxia inhibits growth and selects BCR/Abl-independent cells with stem cell properties which are refractory to imatinib-mesylate. This study aimed to characterize the relationship of this refractoriness with glucose availability in the environment.

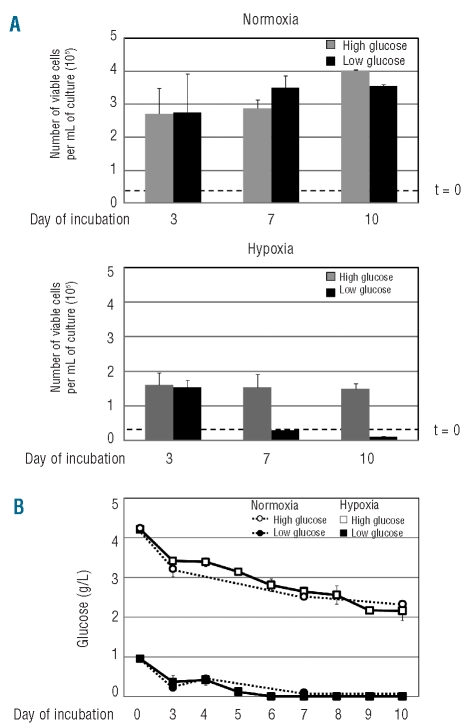
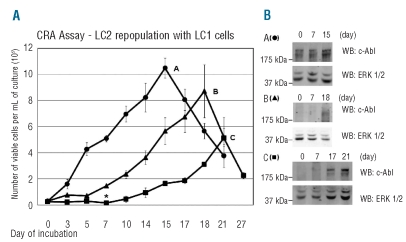
Design and methods: K562 or primary chronic myeloid leukemia cells were cultured at 0.1% O(2), different cell densities and glucose concentrations. The stem and progenitor cell potential of these cultures at different times of incubation in relation to BCR/Abl(protein) expression and sensitivity to imatinib-mesylate was explored by transferring cells to growth-permissive secondary cultures in normoxia, according to the Culture-Repopulating Ability assay methodology.

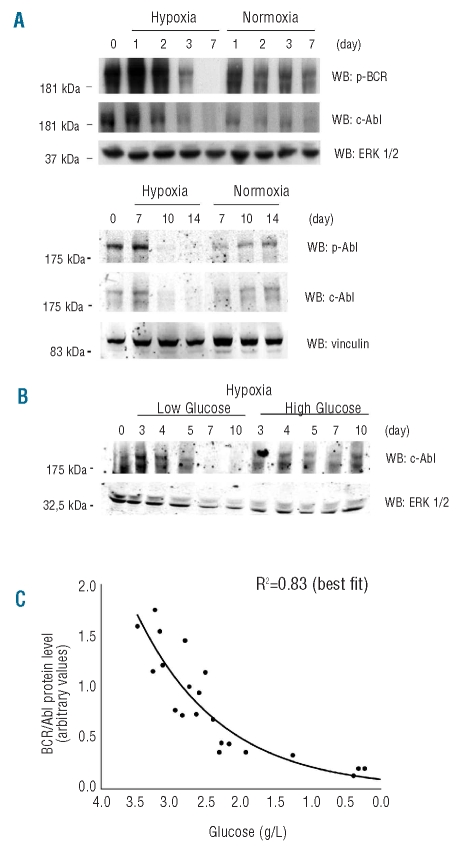
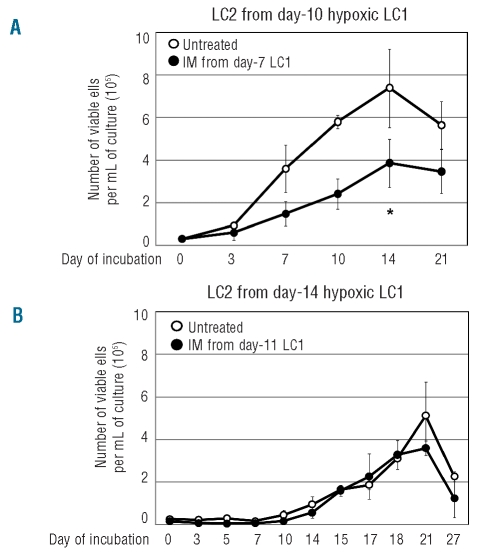
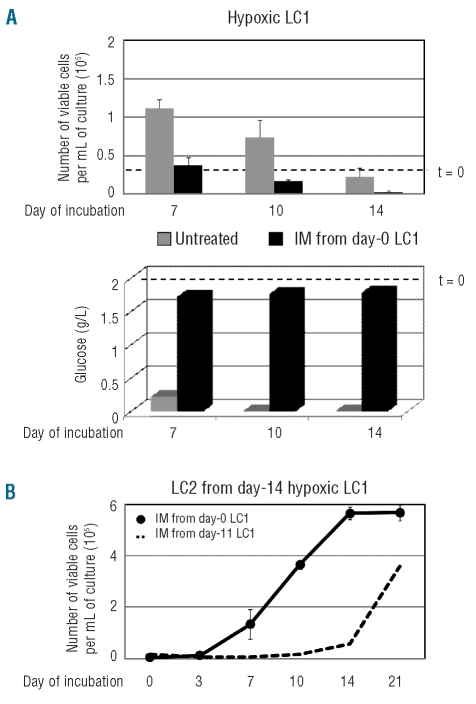
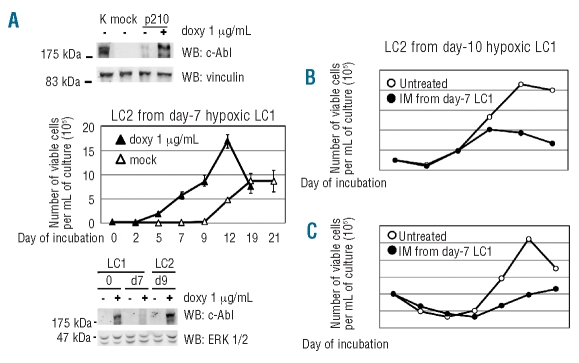
Results: Hypoxia-resistant cells maintained BCR/Abl(protein) expression until glucose was no longer available in primary hypoxic cultures, where glucose availability appeared to regulate cell number and the balance between the enrichment of cells with kinetic properties typical of stem or progenitor cells. Cells surviving merely hypoxic conditions were, upon transfer to secondary cultures, immediately available for numerical expansion due to the maintained BCR/Abl(protein) expression, and were consequently sensitive to imatinib-mesylate. Instead, BCR/Abl(protein)-negative cells selected in primary cultures under oxygen/glucose shortage underwent a delayed numerical expansion in secondary cultures, which was completely refractory to imatinib-mesylate. Cells with the latter properties were also found in primary chronic myeloid leukemia explants.

Conclusions: Glucose shortage in hypoxia was shown to represent the condition selecting BCR/Abl(protein)-negative cells refractory to imatinib-mesylate from either chronic myeloid leukemia lines or patients. These cells, exhibiting stem cell properties in vitro, are metabolically suited to home to stem cell niches in vivo and so may represent the chronic myeloid leukemia cell subset responsible for minimal residual disease.


Figures

Figure 1.
Figure 1.
Effects of hypoxia on cell number and viability and glucose concentration in cultures established at different time 0 cell densities. Exponentially growing K562 cells from routine cultures were replated in fresh medium at 3x10⁵ (left graphs) or 3x10⁴ (right graphs) cells/mL and incubated in normoxia (21% O2) or hypoxia (0.1% O2) for the indicated times. (A) Time-course of the number of viable cells, as determined by trypan blue exclusion; ○: normoxia; ●: hypoxia. Values are means ± S.E.M. of data from 6 independent experiments; the differences between time 0 and day 3 (*; P<0.005) and between day 10 and day 14 (°; P<0.01) were statistically significant. (B) Time-course of the percentage of dead cells, as determined by flow-cytometry of cells stained with propidium iodide (PI) and fluo-resceinated anti-annexin V (aV) antibody. Histograms represent the total percentage of apoptotic plus dead cells (sum of the percentages of aV-positive/PI-negative, aV-negative/PI-positive, double-positive cells). Light gray: time 0; dark gray: normoxia; black: hypoxia. Values are means ± S.E.M. of data from 4 independent experiments. (C) Time-course of glucose concentration in culture medium. Gray: normoxia; black: hypoxia. Dashed lines: time 0 concentration. Values are means ± S.E.M. of data from 3 independent experiments.
Figure 2.
Figure 2.
Effects of different time 0 glucose concentrations on the time-courses of cell number and glucose concentration in normoxic or hypoxic cultures. K562 cells were plated at low density (3x10⁴ cells/mL) in medium containing glucose concentrations double (4.5 g/L; gray; open symbols) or half (1 g/L; black; solid symbols) of that routinely used and incubated in normoxia (A, upper graph; B, dashed lines) or hypoxia (A, lower graph; B, solid lines) for the indicated times. (A) Time-courses of the total number of viable cells (dashed lines: time 0 values). (B) Time-courses of glucose concentration in culture medium. Values are means ± S.E.M. of data from 3 independent experiments.
Figure 3.
Figure 3.
Effects of time 0 cell density or glucose concentration on the time-course of BCR/Ablprotein expression in normoxia or hypoxia. (A, B) K562 cells were plated at 3x10⁵ (A, higher panel) or 3x10⁴ (A, lower panel; B) cells/mL in medium containing standard or low/high (B) glucose concentrations (2, 1 or 4.5 g/L, respectively) and incubated in hypoxia or normoxia (A) or in hypoxia (B) for the indicated times. Total cell lysates were subjected to SDS-PAGE and electroblotting, and proteins revealed using the indicated antibodies. Equalization of protein loading was verified by anti-ERK1/2 or anti-vinculin immunoblotting. For each panel, one representative experiment out of 3 with similar outcome is shown. (C) Relationship between glucose concentration in culture medium and BCR/Ablprotein expression in hypoxic cultures of A and B and of 2 additional, independent experiments. The densitometric values of BCR/Ablprotein bands in cell lysates were plotted in function of glucose concentration in the corresponding culture, irrespective of cell or glucose concentration at time 0 and of incubation time. Only values corresponding to cultures where glucose concentration was reliably detectable (>0.2 g/L) were considered. Values were normalized for the densitometric values of bands used to check equalization of protein loading. The interpolating curve was obtained by best fit and the relative R2 value is reported.
Figure 4.
Figure 4.
Culture-Repopulating Ability (CRA) assay of cells incubated in hypoxia. (A) Time-courses of the number of viable cells in non-selective, normoxic secondary cultures (LC2), as an indicator of the progenitor/stem cell content (CRA) of selective, hypoxic primary cultures (LC1). K562 cells were plated at 3x10⁴ cells/mL in LC1 supplemented with standard glucose concentration and incubated for 7 (●; A), 10 (▴; B) or 14 (▪; C) days in hypoxia. Cells were then replated at 3x10⁴ cells/mL in LC2, to be incubated in normoxia for the indicated times. Values are means ± S.E.M. of data from 4 independent experiments. The difference at day 7 between time-courses B and C was statistically significant (*; P<0.05). (B) BCR/Ablprotein expression in LC2. Cells were lysed at the indicated times, total lysates subjected to SDS-PAGE and electroblotting and proteins revealed by using an anti-c-Abl antibody. Equalization of protein loading was verified by anti-ERK1/2 immunoblotting. For each panel, one representative experiment out of 3 with similar outcome is shown.
Figure 5.
Figure 5.
Effects of imatinib-mesylate (IM) on CRA of cells incubated in hypoxia. Time-courses of the number of viable cells in normoxic LC2 established with cells treated or not with IM 0.5 μM during incubation in hypoxic LC1. LC1 established with 3x10⁴ K562 cells/mL and standard glucose concentration were treated with IM (●) or not (○) from day 7 to day 10 (A) or from day 11 to day 14 (B) and cells then replated at 3x10⁴ cells/mL in LC2 to be incubated in normoxia for the indicated times. Values are means ± S.E.M. of data from 3 independent experiments. In (A), the difference at day 14 between IM-treated and control cultures was statistically significant (*; P<0.05).
Figure 6.
Figure 6.
Effects of IM administered to cells before their incubation in hypoxia. (A) Time-courses of the number of viable cells (upper graph) or glucose concentration in culture medium (lower graph) in hypoxic LC1 established with 3x10⁴ K562 cells/mL and standard glucose concentration, incubated in the absence (gray) or the presence (black) of IM 0.5 μM from time 0. Values are means ± S.E.M. of data from 3 independent experiments (upper graph) or from a single, representative experiment (lower graph). Dashed lines correspond to time 0 values. (B) Time-course of the number of viable cells in normoxic LC2 (CRA) established with 3x10⁴ K562 cells/mL rescued at day 14 from the above LC1 treated with IM from time 0 (●). Values are means ± S.E.M. of data from 3 independent experiments. Dashed line corresponds to the repopulation kinetics of LC2 established with cells rescued at day 14 from hypoxic LC1 treated with IM from day 11 to day 14 of incubation (see Figure 5B).
Figure 7.
Figure 7.
CRA assay of hypoxia-incubated U937 cells expressing or not BCR/Abl or primary CML cells treated or not with IM. (A) Ectopical induction of BCR/Abl in U937 cells (top panel) and BCR/Ablprotein expression in LC1 and LC2 (bottom panel). Total cell lysates were subjected to SDS-PAGE and electroblotting, and proteins revealed by using anti-c-Abl antibody. Equalization of protein loading was verified by anti-vinculin or anti-ERK1/2 immunoblotting. One representative experiment out of 3 with similar outcome is shown. Time-courses of the number of viable cells in normoxic LC2 (CRA) established with U937 cells induced to express BCR/Abl or mock-infected, rescued from hypoxic LC1 (graph). LC1 established at high cell density (3x10⁵ cells/mL) were incubated for 7 days in hypoxia and then cells replated at 3x10⁴ cells/mL in LC2, to be incubated in normoxia for the indicated times; ▵: mock-infected, BCR/Abl-negative cells; ▴: doxycyclin-induced, BCR/Abl-positive cells. Values are means ±S.E.M. of data from 6 independent experiments. (B, C) Time-courses of the number of viable cells in normoxic LC2 (CRA) established with bone marrow cells explanted from blast-crisis (B) or chronic-phase (C) CML patients and rescued from hypoxic LC1 treated (●) or not (○) with IM 1.0 μM from day 7 to day 10 of LC1. LC1 were established at 3x10⁵ cells/mL and LC2 at 105 cells/mL.

References

    1. Giuntoli S, Rovida E, Gozzini A, Barbetti V, Cipolleschi MG, Olivotto M, Dello Sbarba P. Severe hypoxia defines heterogeneity and selects highly immature progenitors within clonal erythroleukemia cells. Stem Cells. 2007;25(5):1119–25. - PubMed
    1. Giuntoli S, Rovida E, Barbetti V, Cipolleschi MG, Olivotto M, Dello Sbarba P. Hypoxia suppresses BCR/Abl and selects Imatinib-insensitive progenitors within clonal CML population. Leukemia. 2006;20(7):1291–3. - PubMed
    1. Dello Sbarba P, Cipolleschi MG, Olivotto M. Hemopoietic progenitor cells are sensitive to the cytostatic effect of pyruvate. Exp Hematol. 1987;15(2):137–42. - PubMed
    1. Cipolleschi MG, Dello Sbarba P, Olivotto M. The role of hypoxia in the maintenance of hematopoietic stem cells. Blood. 1993;82(7):2031–7. - PubMed
    1. Parmar K, Mauch P, Vergilio JA, Sackstein R, Down JD. Distribution of hematopoietic stem cells in the bone marrow according to regional hypoxia. Proc Natl Acad Sci USA. 2007;104(13):5431–6. - PMC - PubMed

Publication types

MeSH terms