. 2011 Jan;22(1):59-72.
doi: 10.1681/ASN.2009121267. Epub 2010 Nov 11.

Calcitonin has a vasopressin-like effect on aquaporin-2 trafficking and urinary concentration

Affiliations

Calcitonin has a vasopressin-like effect on aquaporin-2 trafficking and urinary concentration

Richard Bouley et al. J Am Soc Nephrol. 2011 Jan.

Abstract

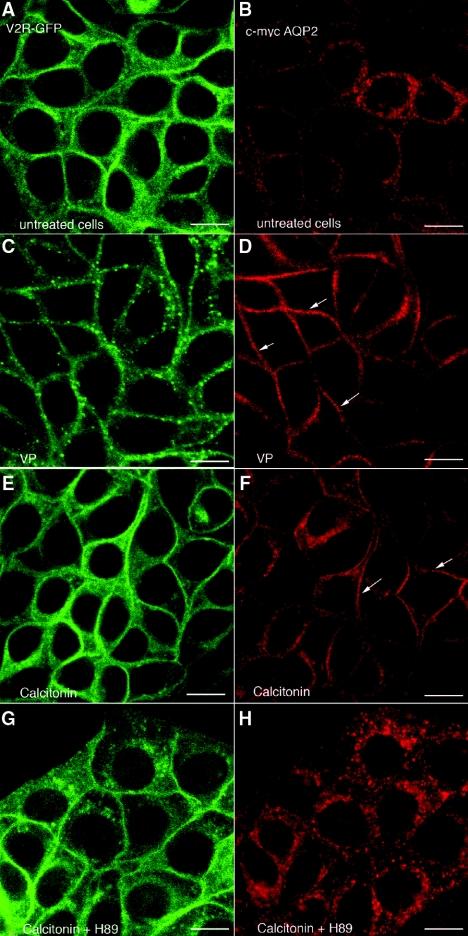
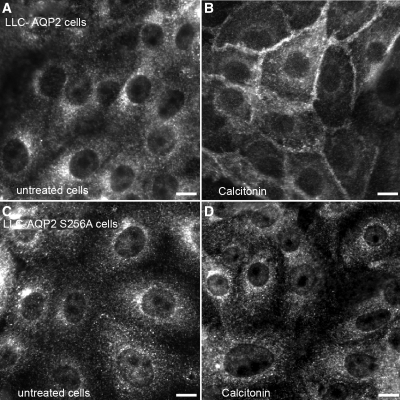
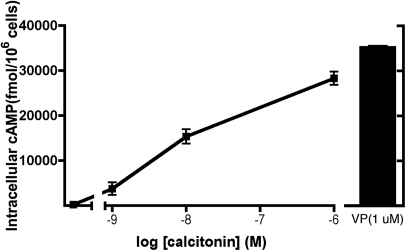
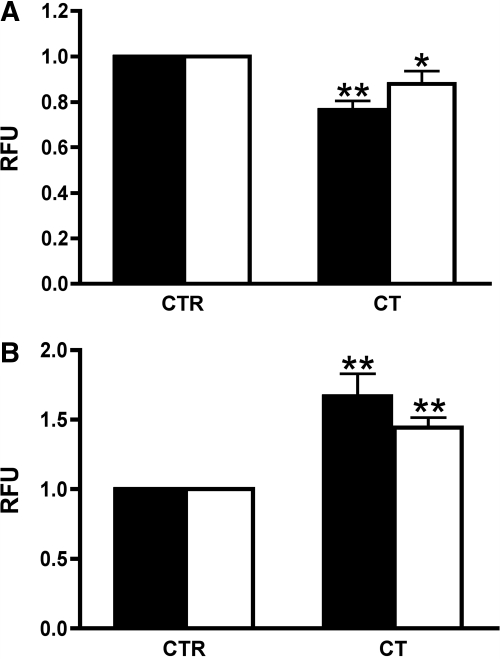
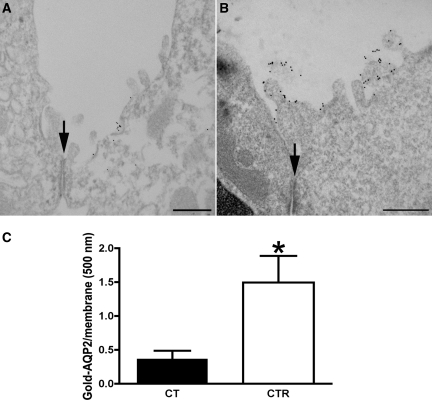
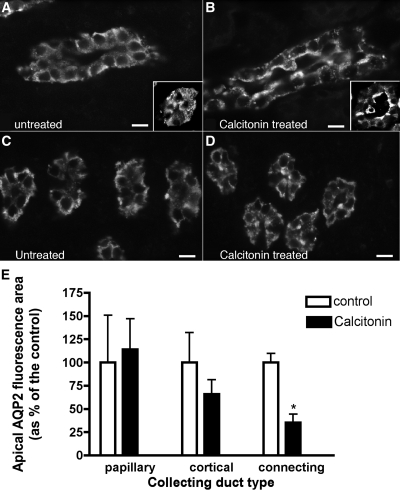
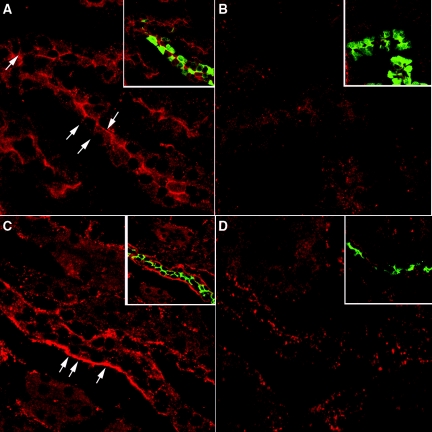
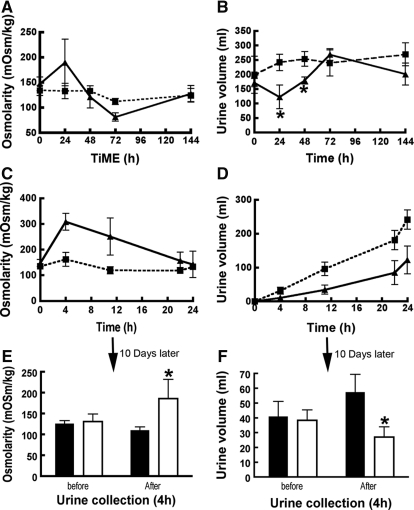
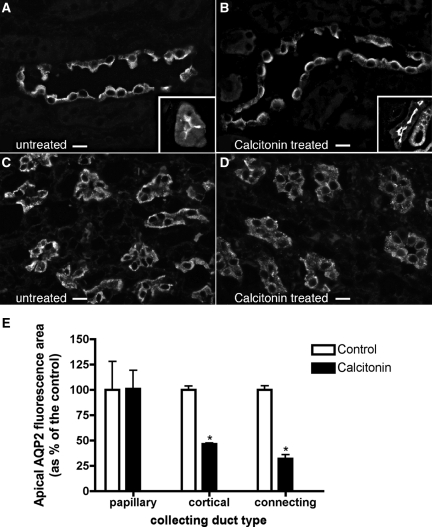
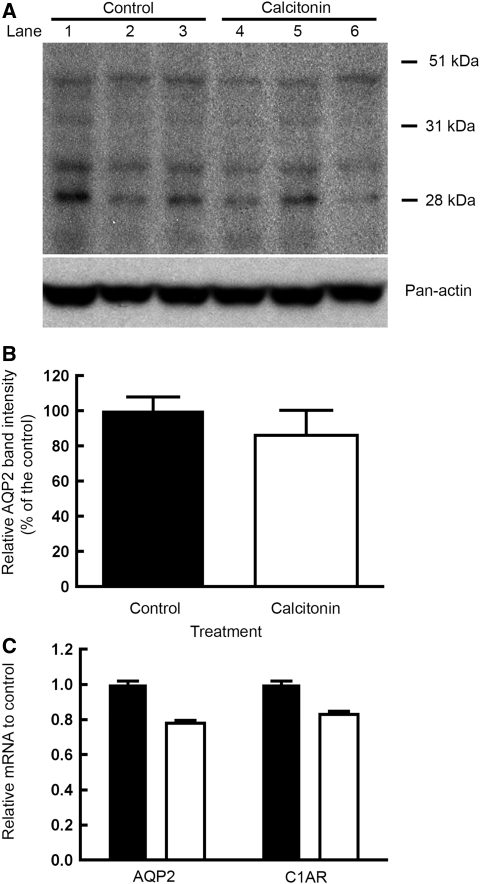
The most common cause of hereditary nephrogenic diabetes insipidus is a nonfunctional vasopressin (VP) receptor type 2 (V2R). Calcitonin, another ligand of G-protein-coupled receptors, has a VP-like effect on electrolytes and water reabsorption, suggesting that it may affect AQP2 trafficking. Here, calcitonin increased intracellular cAMP and stimulated the membrane accumulation of AQP2 in LLC-PK1 cells. Pharmacologic inhibition of protein kinase A (PKA) and deficiency of a critical PKA phosphorylation site on AQP2 both prevented calcitonin-induced membrane accumulation of AQP2. Fluorescence assays showed that calcitonin led to a 70% increase in exocytosis and a 20% decrease in endocytosis of AQP2. Immunostaining of rat kidney slices demonstrated that calcitonin induced a significant redistribution of AQP2 to the apical membrane of principal cells in cortical collecting ducts and connecting segments but not in the inner stripe or inner medulla. Calcitonin-treated VP-deficient Brattleboro rats had a reduced urine flow and two-fold higher urine osmolality during the first 12 hours of treatment compared with control groups. Although this VP-like effect of calcitonin diminished over the following 72 hours, the tachyphylaxis was reversible. Taken together, these data show that calcitonin induces cAMP-dependent AQP2 trafficking in cortical collecting and connecting tubules in parallel with an increase in urine concentration. This suggests that calcitonin has a potential therapeutic use in nephrogenic diabetes insipidus.


Figures

Figure 1.
Figure 1.
CT stimulates AQP2 accumulation in the plasma membrane of kidney epithelial cells without affecting V2R-GFP distribution. Confocal immunofluorescence microscopy shows V2R-GFP and AQP2 in LLC-VA cells before and after treatment with VP and CT with or without the PKA inhibitor H89. (A and B) In nonstimulated cells, V2R-GFP (green) is concentrated in the plasma membrane (A), whereas AQP2 (red) remains in cytoplasmic vesicles localized mainly around the nucleus (B). (C through F) In contrast, AQP2 shows plasma membrane localization (arrows) after incubation for 10 minutes with 10 nM VP (D) or 100 nM CT (F). V2R-GFP was partially internalized into cytoplasmic vesicles at this early time point after VP treatment (C), but its distribution was not changed by CT treatment (E). (G and H) The presence of H89 did not effect V2R distribution (G), but the effect of CT on the distribution of AQP2 was completely abolished in the presence of this inhibitor (H). These images are representative of three independent experiments. The bar indicates 10 μm.
Figure 2.
Figure 2.
Wild-type AQP2, but not S256A mutant AQP2, accumulates at the plasma membrane in the presence of CT. Indirect immunofluorescence microscopy of AQP2 staining in LLC-AQP2 wild type and S256A mutant expressing cells incubated in the presence or absence of CT. The AQP2 (S256A) mutant is located on intracellular vesicles similar to wild type AQP2 in basal conditions (A and C, respectively). After CT treatment (100 nM, 10 minutes) AQP2 wild type accumulates at the plasma membrane (B), whereas localization of the AQP2 (S256A) mutant is unchanged (D). These images are representative of three independent experiments. The bar indicates 10 μm.
Figure 3.
Figure 3.
CT increases the intracellular levels of cAMP in LLC-VA cells. The cells were incubated for 10 minutes with several concentrations of CT (1, 10, and 1000 nM). After incubation, the cells were solubilized, and supernatants were used to measure intracellular cAMP using an ELISA assay. CT stimulation was compared with the elevation of cAMP (35,196 ± 471 fmol/106 cells) determined in the presence of a saturating concentration of VP (1 μM). Each point represents the mean ± SD of triplicate determinations. This figure is representative of three independent experiments.
Figure 4.
Figure 4.
CT increases exocytosis and reduces endocytosis in LLC-AQP2-ssYFP and LLC-ssYFP cells. (A) The endocytosis assay shows a reduction of Texas Red dextran internalization into LLC-AQP2-ssYFP (solid bar) and LLC-ssYFP cells (open bar) incubated with CT (100 nM) compared with untreated cells (CTR). (B) In the exocytosis assay, an increased secretion of ssYFP from both LLC-AQP2-ssYFP (solid bar) and LLC-ssYFP cells (open bar) was stimulated by CT. This figure is representative of three different experiments (means ± SD; *P < 0.05; **P < 0.01).
Figure 5.
Figure 5.
Immunogold electron microscopy shows apical plasma membrane insertion of AQP2 induced by CT in vivo. AQP2 was localized by pre-embedding labeling of thick, nonpermeabilized vibratome sections kidney cortical tissue with an antibody against an external epitope of AQP2. Only plasma membrane AQP2 is detected using this procedure. CT treatment (B) showed a significant amount of AQP2 plasma membrane associated with the apical membrane and microvilli, whereas AQP2 in the apical plasma membrane was much less abundant in cortical kidney sections of the untreated rats (A). These results support the epifluorescence microscopy data shown in Figures 6 and 9. The number of gold particles labeling AQP2 is expressed per micrometer of apical membrane length (C). Images of two to three tubules from each tissue were analyzed with ImageJ software (National Institutes of Health). The density of AQP2 at the apical plasma membrane (open bar) was compared with the density of AQP2 in the apical membranes of untreated rats (solid bar) (means ± SEM; n = 3; *P < 0.05). The position of the cell junction between a principal cell (B) and an AQP2-negative intercalated cell (A) is indicated with an arrow in each figure. The bar indicates 0.5 μm.
Figure 6.
Figure 6.
Indirect immunofluorescence images of kidney tissue slices showing AQP2 in principal cells of cortical or inner medullary collecting ducts. One rat kidney was cut into thin slices and incubated in vitro with buffer (A and C) or with CT (B and D) for 1 hour before fixation by immersion, sectioning, and immunostaining to detect AQP2. Under control conditions, AQP2 was mainly localized throughout the cytoplasm and showed little apical membrane staining in collecting ducts from the cortex (A) and inner medulla (C), as well as in cortical connecting segments (inset). In the presence of CT, AQP2 staining of the apical membrane region was increased in principal cells of the cortical collecting duct (B) and in connecting segments (inset), but AQP2 remained localized in the cytoplasm in the inner medulla (D). Quantification of the effect of CT on AQP2 in principal cells (E) showed that CT induced a significant apical redistribution that was most apparent in the connecting segment but also was significant in the cortical collecting duct. No effect on AQP2 distribution was detectable in the inner medulla. The images are representative of three independent experiments. The quantification shows the means of more than 100 cells taken from the three different experiments (means ± SEM; n = 3; *P < 0.05). The bar indicates 10 μm.
Figure 7.
Figure 7.
Indirect immunofluorescence images of kidney showing CT receptor in cortical collecting ducts and connecting segments. One rat kidney was fixed by immersion, sectioned and immunostained to detect the CT receptor as well as AQP2 and calbindin. The CT receptor is located in the apical membrane in cortical tubules (A) that costain for calbindin (A, inset, green), a marker of cortical connecting segments. Apical staining is completely abolished in the presence of directed antibody peptide (B) in calbindin-positive tubules (B, inset). Mainly basolateral CT receptor staining was observed in cortical collecting ducts (C). Both the CT receptor (red) and AQP2 (green) colocalized in the same cells (C, inset). This CT receptor staining was abolished in the presence of peptide inhibitor (D, inset), although some spots of nonspecific fluorescence remain scattered throughout the section. The images are representative of three independent experiments.
Figure 8.
Figure 8.
Urine volume decreases and urine osmolarity increases in CT-treated rats. Metabolic cage analysis of the volume and urine osmolality from Brattleboro rats infused with CT or saline. Brattleboro rats were implanted with osmotic minipumps that deliver saline or CT (2 mU/min/100 g rat) for 7 days. Urine osmolality and volume were not modified in animals treated with saline (■) (A and B, respectively). In contrast, the urine osmolality was significantly increased and its volume was reduced during the first 24 hours in CT-perfused animals (▴) (A and B, respectively). Osmolality of the urine from both groups was analyzed after 4, 11, 22, and 24 hours (C). The osmolality of urine from CT-treated rats (▴) increased rapidly and then declined over time, whereas the osmolality of saline-treated animals was low and stable (■). In parallel, the urine volume of saline-treated groups (■) was greater than animals treated with CT (▴) (D). After removing the pumps for 10 days, the same rats were once again challenged with CT, and their urine osmolality and volume were analyzed (E and F, respectively). A 4-hour urine collection was performed before and after reperfusion of animals with saline (solid bar) or CT (open bar), and the rats were then perfusion-fixed for analysis of AQP2 distribution in their kidneys (see Figure 9). Those results represent the average values obtained from three different animals (means ± SD; *P < 0.05). The bar indicates 10 μm.
Figure 9.
Figure 9.
Indirect immunofluorescence of sections from rat kidney showing AQP2 in principal cells of cortical and inner medullary collecting ducts with and without CT treatment in vivo. After implantation of minipumps containing either saline or CT for 4 hours, the animals were anesthetized, and the kidneys were fixed by perfusion, followed by sectioning and immunostaining to detect AQP2. (A through C) Under control conditions, AQP2 is localized toward the apical pole of collecting ducts from the cortex (A) and inner medulla (C), as well as the cortical connecting segment (A, inset), but in the presence of CT, AQP2 is more sharply concentrated at the apical pole of principal cells from the cortical collecting duct (B) and in cells of the connecting segment (B, inset), reflecting a reduction in cytoplasmic vesicle staining and an increase in apical membrane staining (see also Figure 6). (D) CT had no effect in the inner medulla, where AQP2 remained localized throughout the cytoplasm. (E) Quantification of the effect of CT on AQP2 redistribution in principal cells showed a significant increase in apical staining in both cortical collecting ducts and, to an even greater extent, connecting segments. No effect was detected in the inner medulla. The images are representative of three independent incubations, and quantification shows the mean of more then 100 cells taken from the three different experiments (means ± SEM; *P < 0.05). The bar indicates 10 μm.
Figure 10.
Figure 10.
CT has no effect on either the level of AQP2 protein or mRNA expression in kidney cortex. The effect of CT on AQP2 expression in the kidney cortex was investigated at the protein (A and B) and gene level (C) using Western blot and real-time PCR techniques. Cortex of the untreated and treated rats (24 hours CT) were homogenized and separated by SDS-PAGE. Each lane represents a single animal. Western blot analysis (A) was performed on three different control tissues (lanes 1 to 3) and CT-treated rat kidneys (lanes 4 to 6). AQP2 was detected by Western blot using an anti-AQP2 antibody directed against the second extracellular region of AQP2. Densitometric analysis of Western blot (B) of immunodetected AQP2 (28 kD) and the glycosylated band around 40 kD was performed. The band intensities were normalized by loading controls. The average intensity of three untreated rats (solid bar) was NS compared with the average band intensity of CT-treated rats (open bar). The data are the means ± SD (n = 3). Real-time PCR (C) showed that CT did not affect AQP2 or CT receptor mRNA. Real-time PCR analysis showed no effect on the level of AQP2 and CT receptor mRNA in rats treated for 24 hours with calcitonin (open bar) compared with the levels of AQP2 mRNA in untreated rats (solid bar). The data are the means ± SD (n = 3).

References

    1. Bichet DG, Razi M, Arthus MF, Lonergan M, Tittley P, Smiley RK, Rock G, Hirsch DJ: Epinephrine and dDAVP administration in patients with congenital nephrogenic diabetes insipidus: Evidence for a pre-cyclic AMP V2 receptor defective mechanism. Kidney Int 36: 859–866, 1989 - PubMed
    1. Canfield MC, Tamarappoo BK, Moses AM, Verkman AS, Holtzman EJ: Identification and characterization of aquaporin-2 water channel mutations causing nephrogenic diabetes insipidus with partial vasopressin response. Hum Mol Genet 6: 1865–1871, 1997 - PubMed
    1. Vargas-Poussou R, Forestier L, Dautzenberg MD, Niaudet P, Dechaux M, Antignac C: Mutations in the vasopressin V2 receptor and aquaporin-2 genes in 12 families with congenital nephrogenic diabetes insipidus. J Am Soc Nephrol 8: 1855–1862, 1997 - PubMed
    1. Brown D: The ins and outs of aquaporin-2 trafficking. Am J Physiol Renal Physiol 284: F893–F901, 2003 - PubMed
    1. Deen PM, Verdijk MA, Knoers NV, Wieringa B, Monnens LA, van Os CH, van Oost BA: Requirement of human renal water channel aquaporin-2 for vasopressin-dependent concentration of urine. Science 264: 92–95, 1994 - PubMed

Publication types

MeSH terms