. 2011 Jan;4(1):137-49.
doi: 10.1158/1940-6207.CAPR-10-0025. Epub 2010 Nov 11.

A migration signature and plasma biomarker panel for pancreatic adenocarcinoma

Affiliations

A migration signature and plasma biomarker panel for pancreatic adenocarcinoma

Seetharaman Balasenthil et al. Cancer Prev Res (Phila). 2011 Jan.

Abstract

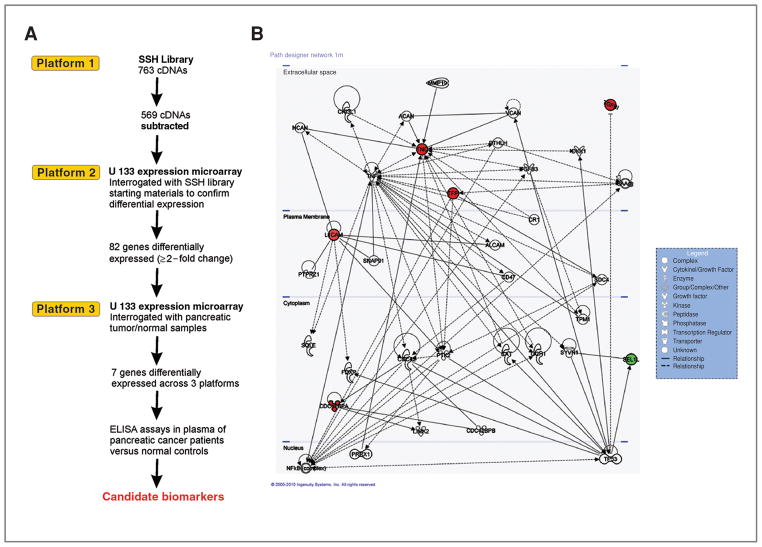
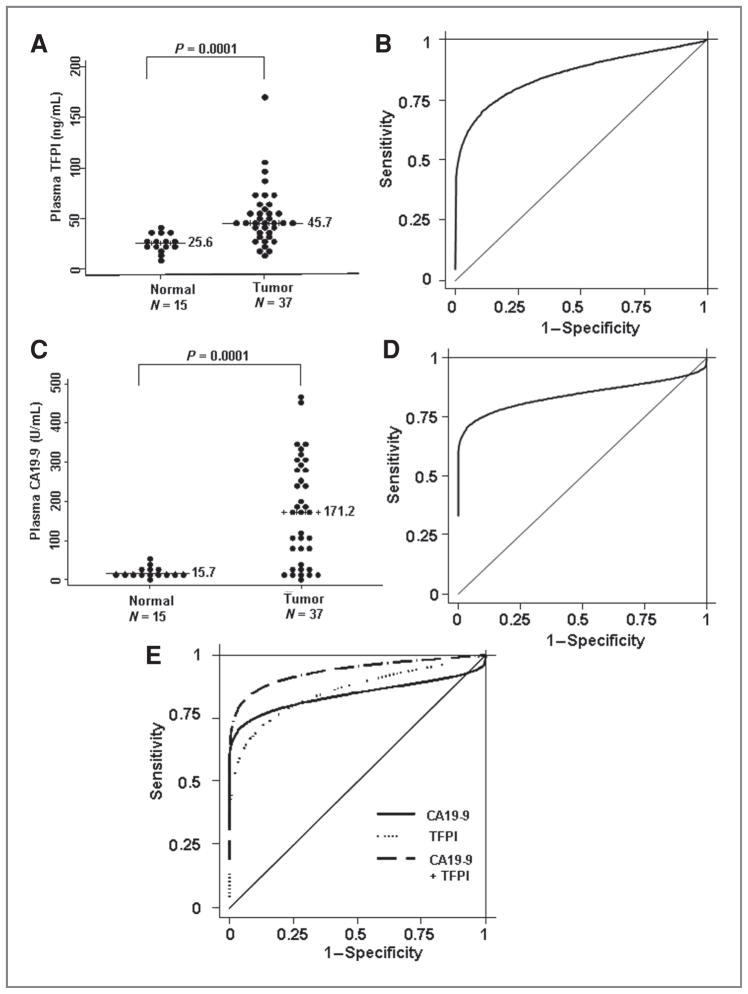
Pancreatic ductal adenocarcinoma is a disease of extremely poor prognosis for which there are no reliable markers of asymptomatic disease. To identify pancreatic cancer biomarkers, we focused on a genomic interval proximal to the most common fragile site in the human genome, chromosome 3p12, which undergoes smoking-related breakage, loss of heterozygosity, and homozygous deletion as an early event in many epithelial tumors, including pancreatic cancers. Using a functional genomic approach, we identified a seven-gene panel (TNC, TFPI, TGFBI, SEL-1L, L1CAM, WWTR1, and CDC42BPA) that was differentially expressed across three different expression platforms, including pancreatic tumor/normal samples. In addition, Ingenuity Pathways Analysis (IPA) and literature searches indicated that this seven-gene panel functions in one network associated with cellular movement/morphology/development, indicative of a "migration signature" of the 3p pathway. We tested whether two secreted proteins from this panel, tenascin C (TNC) and tissue factor pathway inhibitor (TFPI), could serve as plasma biomarkers. Plasma ELISA assays for TFPI/TNC resulted in a combined area under the curve (AUC) of 0.88 and, with addition of CA19-9, a combined AUC for the three-gene panel (TNC/TFPI/CA19-9), of 0.99 with 100% specificity at 90% sensitivity and 97.22% sensitivity at 90% specificity. Validation studies using TFPI only in a blinded sample set increased the performance of CA19-9 from an AUC of 0.84 to 0.94 with the two-gene panel. Results identify a novel 3p pathway-associated migration signature and plasma biomarker panel that has utility for discrimination of pancreatic cancer from normal controls and promise for clinical application.


Conflict of interest statement

Disclosure of Potential Conflicts of Interest

No potential conflicts of interest were disclosed.

Figures

Figure 1
Figure 1
A, schematic flow diagram of functional genomic approach to identify chromosome 3p12 pathway genes. Three expression platforms are denoted that were screened to identify candidates for validation in plasma as potential pancreatic cancer biomarkers. B, putative gene network derived from IPA software. Edges are displayed with labels that describe the nature of the relationship between the nodes. The lines between genes represent known interactions, with solid lines representing direct interactions and dashed lines representing indirect or hypothetical interactions. Color highlighting (red, upregulation; green, downregulation) indicates pathway-associated genes discovered by this study and nonhighlighted genes are those identified by IPA.
Figure 2
Figure 2
Candidate biomarkers from functional genomic approach validated in plasma of pancreatic cancer patients versus controls. A, plasma TNC-L concentrations of pancreatic carcinoma patients and normal subjects. Line, median plasma TNC level. The difference between normal and pancreatic adenocarcinoma samples is statistically significant (Mann–Whitney’s U test, P = 0.0004). B, ROC curve for differentiating normal and pancreatic carcinoma patients on the basis of the plasma TNC ELISA assay. The AUC was 0.79. The specificity was 47% given 90% sensitivity and the sensitivity was 25% given 90% specificity; C, plasma TFPI concentrations in pancreatic carcinoma patients and normal subjects. Line, median plasma TFPI level. The difference between normal and pancreatic adenocarcinoma samples is statistically significant (Mann–Whitney’s U test, P < 0.0001). D, ROC curve for differentiating normal and pancreatic carcinoma patients on the basis of the plasma TFPI ELISA assay. The AUC was 0.87. The specificity was 63% given 90% sensitivity and the sensitivity was 64% given 90% specificity; E, ROC curve for differentiating normal and pancreatic carcinoma patients on the basis of the combinations of 2 markers, plasma TNC and TFPI ELISA. The combined AUC is 0.88. F, plasma CA19-9 concentrations of pancreatic carcinoma patients and normal subjects. Line, median plasma CA19-9 level. The difference between normal and pancreatic adenocarcinoma samples is statistically significant (Mann–Whitney’s U test, P < 0.00001). G, ROC curve for differentiating normal and pancreatic carcinoma patients on the basis of plasma CA19-9 ELISA assay. The AUC was 0.93, with a specificity of 94.74% at 90% sensitivity and sensitivity of 91.67% at 90% specificity; H, ROC curve for differentiating normal and pancreatic carcinoma patients on the basis of combinations of 2 markers, plasma CA19-9 and TFPI ELISA. The combined AUC was 0.99.
Figure 3
Figure 3
A, plasma TFPI concentrations of pancreatic carcinoma patients and normal subjects. Line, median plasma TFPI level. The difference between normal and pancreatic adenocarcinoma samples is statistically significant (Mann–Whitney’s U test, P= 0.0001). B, ROC curve for differentiating normal and pancreatic carcinoma patients on the basis of plasma TFPI ELISA assay. The AUC was 0.87 with a specificity of 46.67% at 90% sensitivity and 70.27% sensitivity at 90% specificity. C, plasma CA19-9 concentrations of pancreatic carcinoma patients and normal subjects. Line, median plasma CA19-9 level. The difference between normal and pancreatic adenocarcinoma samples is statistically significant (Mann–Whitney’s U test, P= 0.0001). D, ROC curve for differentiating normal and pancreatic carcinoma patients on the basis of plasma CA19-9 ELISA assay. The AUC was 0.84, with a specificity of 13.33% at 90% sensitivity and 75.68% sensitivity at 90% specificity. E, ROC curve for differentiating normal and pancreatic carcinoma patients on the basis of combinations of 2 markers, plasma CA19-9 and TFPI ELISA. The combined AUC was 0.94 and resulted in a specificity of 86.67% at 90% sensitivity and 83.78% sensitivity at 90% specificity.

References

    1. Jemal A, Siegel R, Ward E, Hao Y, Xu J, Thun MJ. Cancer Statistics, 2009. CACancer J Clin. 2009;59:225–49. - PubMed
    1. Kim HR, Lee CH, Kim YW, Han SK, Shim YS, Yim JJ. Increased CA 19–9 level in patients without malignant disease. Clin Chem Lab Med. 2009;47:750–4. - PubMed
    1. Blackford A, Parmigiani G, Kensler TW, Wolfgang C, Jones S, Zhang X, et al. Genetic mutations associated with cigarette smoking in pancreatic cancer. Cancer Res. 2009;69:3681–8. - PMC - PubMed
    1. Stein CK, Glover TW, Palmer JL, Glisson BS. Direct correlation between FRA3B expression and cigarette smoking. Genes Chromosomes Cancer. 2002;34:333–40. - PubMed
    1. Shridhar R, Shridhar V, Wang X, Paradee W, Dugan M, Sarkar F, et al. Frequent breakpoints in the 3p14. 2 fragile site, FRA3B, in pancreatic tumors. Cancer Res. 1996;56:4347–50. - PubMed

Publication types

MeSH terms