. 2011 Mar 14;52(3):1392-403.
doi: 10.1167/iovs.10-5984. Print 2011 Mar.

Claudin-19 and the barrier properties of the human retinal pigment epithelium

Affiliations

Claudin-19 and the barrier properties of the human retinal pigment epithelium

Shaomin Peng et al. Invest Ophthalmol Vis Sci. .

Abstract

Purpose: The retinal pigment epithelium (RPE) separates photoreceptors from choroidal capillaries, but in age-related macular degeneration (AMD) capillaries breach the RPE barrier. Little is known about human RPE tight junctions or the effects of serum on the retinal side of the RPE.

Methods: Cultured human fetal RPE (hfRPE) was assessed by the transepithelial electrical resistance (TER) and the transepithelial diffusion of methylated polyethylene glycol (mPEG). Claudins and occludin were monitored by quantitative RT-PCR, immunoblotting, and immunofluorescence.

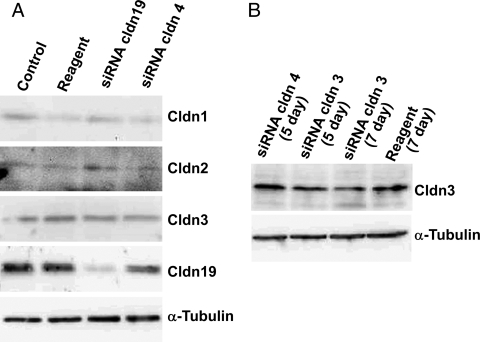
Results: Similar to freshly isolated hfRPE, claudin-19 mRNA was 25 times more abundant than claudin-3. Other detectable claudin mRNAs were found in even lesser amounts, as little as 3000 times less abundant than claudin-19. Claudin-1 and claudin-10b were detected only in subpopulations of cells, whereas others were undetectable. Knockdown of claudin-19 by small interfering RNA (siRNA) eliminated the TER. siRNAs for other claudins had minimal effects. Serum affected tight junctions only when presented to the retinal side of the RPE. The TER increased 2 times, and the conductance of K(+) relative to Na(+) decreased without affecting the permeability of mPEG. These effects correlated with increased steady-state levels of occludin.

Conclusions: Fetal human RPE is a claudin-19-dominant epithelium that has regional variations in claudin-expression. Apical serum decreases RPE permeability, which might be a defense mechanism that would retard the spread of edema due to AMD.


Figures

Figure 1.
Figure 1.
Effect of culture medium on the TER. Cultures of hfRPE were maintained in growth medium until the TER was stable with time. (A) On day 0, cultures were continued in growth medium or switched to the medium indicated on the graph. The percentage of serum contained in each medium is indicated on the graph. The presence of serum reduced the decline of TER in serum-free medium. (B) On day 35, cultures that had been maintained in serum-free medium were continued in serum-free medium or switched to: serum-free medium supplemented with 5% FBS in the apical chamber, serum-free medium in the basal chamber; serum-free medium in the apical chamber, serum-free medium supplemented with 5% FBS in the basal chamber, and serum-free medium supplemented with 5% FBS in both chambers. The TER increased only if serum was added to the apical medium chamber. The gray bar indicates the TER of native hfRPE ± SEM. Error bars, SEM for 4 to 6 filters. GM, growth medium; SFM, serum-free medium.
Figure 2.
Figure 2.
Conductance in media that inhibit transport along the transcellular pathway. The TER was measured in buffered solutions that contained either NaCl or KCl. The solutions included BaCl2 to inhibit K+ channels and lacked CO2 to inhibit bicarbonate-coupled channels. The cultures were incubated first in NaCl buffer, followed by KCl buffer. Reversing the order of the buffers had no effect on the result. The TER was measured in growth medium before and after the experiment to confirm the cultures remained healthy throughout the experiment. The results are reported as the conductance, G, which is the inverse of the TER. Experiments were performed in triplicate. Similar results were obtained with independent cultures. Error bars, SD.
Figure 3.
Figure 3.
Effect of culture conditions on the apparent permeation coefficient for mPEG550 relative to mPEG350. Permeation was measured in the apical-to-basal (dark gray bars) or basal-to-apical (light gray bars) direction. P550 and P550/P350 were greater in the apical-to-basal direction if there was no serum present in the apical medium chamber. Serum had minimal effect on diffusion in the basal-to-apical direction. Experiments were performed in triplicate. Similar results were obtained with independent cultures. Error bars, SD; pairs with a statistical difference (P < 0.01).
Figure 4.
Figure 4.
Expression of claudins and occludin in freshly isolated hfRPE. (A) Total RNA was isolated from four fetuses and analyzed by quantitative, real-time RT-PCR. The data were normalized to GAPDH and expressed relative to claudin-19, as described in this article. (B) Claudin-10 was analyzed by 35 cycles of RT-PCR using primers that were specific for either claudin-10a or claudin-10b. RNA from human kidney was used as a positive control. Size markers in the left lane are from a HaeIII digest of ΦX174: 1353, 1078, 872, and 603 base pairs. Error bars, SD; cldn, claudin.
Figure 5.
Figure 5.
Expression of claudins and occludin in vitro. hfRPE was isolated from two fetuses and cultured independently. Each isolate was maintained in the medium indicated in each panel. Total RNA was extracted from each culture and analyzed in triplicate. The amount of mRNA relative to claudin-19 was estimated by quantitative RT-PCR. The columns indicate the mean of the data obtained from the two sets of cultures, whereas the error bars indicate the range. (A) Comparison of growth medium and serum-free medium. Cultures were maintained, as described in Figure 1A. Data are expressed relative to the expression of claudin-19. For reference, horizontal bars indicate the level of expression in vivo (Fig. 4). (B) Effects of adding serum to the apical or basal side of the monolayer. Cultures maintained in serum-free medium were readapted to serum, as indicated in Figure 1B. Data were expressed relative to expression in serum-free medium. Generally, serum had minimal effect on the expression of the mRNAs tested. Error bars, SD; cldn, claudin.
Figure 6.
Figure 6.
Effects of culture conditions on the steady-state levels of claudin expression. The samples for the left three lanes were cultured as described in Figure 1A. The samples for the right four lanes were cultured as described in Figure 1B. Protein from each culture was extracted and immunoblotted. The blots were representative of cultures derived from multiple fetuses. Serum in the apical chamber increased the expression of claudin-1 and claudin-3. GM, growth medium; SFM, serum-free medium.
Figure 7.
Figure 7.
Effects of culture conditions on the steady-state levels of occludin expression. The samples for the left three lanes were cultured as described in Figure 1A. The samples for the right four lanes were cultured as described in Figure 1B. Protein from each culture was extracted and immunoblotted. The blots were representative of cultures derived from multiple fetuses. Only high Mr isoforms were observed. Expression was highest when serum was present in the apical medium chamber. GM, growth medium; SFM, serum-free medium.
Figure 8.
Figure 8.
Effect of culture conditions on the distribution of tight junction proteins. hfRPE was cultured in growth medium or serum-free medium and double labeled for claudin and either occludin, ZO-1, or actin, as indicated. Confocal images were captured in the plane of the tight junctions. ZO-1, actin, and occludin were uniformly expressed, but the undulating nature of the filter brought the tight junctions in and out of the confocal plane. The strips above and to the right of the x-y plane are the x-z and y-z planes, respectively. Regardless of the secondary antibody that was used, claudins appear red, the counterlabel is green, and the overlap of the two appears as shades of yellow. Nuclei were revealed by DAPI (blue). Claudin-3 and claudin-19 were evident in all cells. Claudin-1 and claudin-10 were evident only in subsets of cells, but more positive cells were observed in serum-free medium. Arrows: claudin-1–positive cells; bar, 20 μm.
Figure 9.
Figure 9.
Co-localization of claudin-1 with occludin. hfRPE was cultured in serum-free medium and double labeled for claudin and occludin. A three-dimensional reconstruction of a confocal image stack demonstrates that claudin-1 localized to tight junctions. Similar results were obtained with hfRPE cultured in growth medium. Red: Claudin-1; green: occludin; yellow to orange: co-localized claudin-1 and occludin.
Figure 10.
Figure 10.
Claudin and occludin mRNA expression after transfection with a siRNA cocktail that targets claudin-19. Expression levels of each claudin was expressed relative to its expression in control cells that were transfected with siRNA to claudin-4. (A) Time course for the effect of siRNA on claudin-19 expression. (B) On day 5, occludin and most claudins show <2 times change in expression with the exception of claudin-1. The columns indicate the mean of triplicate determinations obtained from each of two independent cultures of hfRPE, whereas the error bars indicate the range.
Figure 11.
Figure 11.
Effect of claudin knockdown by siRNA. Protein from the indicated culture was extracted and immunoblotted. (A) Claudin-19 siRNA: Protein was extracted from cultures 5 days post-transfection. (B) Claudin-3 siRNA: Protein was extracted from cultures 5 or 7 days post-transfection. Each siRNA was able to reduce the expression of its claudin. Control, nontransfected; reagent, mock-transfected.
Figure 12.
Figure 12.
Effect of claudin-19 siRNA on tight junctions: cultures maintained in growth medium. Representative images demonstrate that claudins, occludin, actin, and ZO-1 colocalized at tight junctions even though the TER was only ∼20 Ω × cm2. Note that in contrast with Figure 8, the fluorescence signal for claudin-19 is weaker than the signal for claudin-3 and ZO-1. Immunolabeling was performed as described in the legend to Figure 8. Bar, 10 μm.

Similar articles

Cited by

References

    1. Marmor MF, Wolfensberger TJ. The Retinal Pigment Epithelium: Function and Disease. New York: Oxford University Press; 1998
    1. Chang C, Wang X, Caldwell RB. Serum opens tight junctions and reduces ZO-1 protein in retinal epithelial cells. J Neurochem. 1997;69:859–867 - PubMed
    1. Peng S, Rahner C, Rizzolo LJ. Apical and basal regulation of the permeability of the retinal pigment epithelium. Invest Ophthalmol Vis Sci. 2003;44:808–817 - PubMed
    1. Strauss O. The retinal pigment epithelium in visual function. Physiol Rev. 2005;85:845–881 - PubMed
    1. Chen SY, Bhargava A, Mastroberardino L, et al. Epithelial sodium channel regulated by aldosterone-induced protein sgk. Proc Natl Acad Sci U S A. 1999;96:2514–2519 - PMC - PubMed

Publication types

MeSH terms