. 2011 Apr;18(4):666-77.
doi: 10.1038/cdd.2010.139. Epub 2010 Nov 12.

PTEN status switches cell fate between premature senescence and apoptosis in glioma exposed to ionizing radiation

Affiliations

PTEN status switches cell fate between premature senescence and apoptosis in glioma exposed to ionizing radiation

J-J Lee et al. Cell Death Differ. 2011 Apr.

Abstract

Loss of the tumor suppressor phosphatase and tensin homolog (PTEN) has frequently been observed in human gliomas, conferring AKT activation and resistance to ionizing radiation (IR) and drug treatments. Recent reports have shown that PTEN loss or AKT activation induces premature senescence, but many details regarding this effect remain obscure. In this study, we tested whether the status of PTEN determined fate of the cell by examining PTEN-deficient U87, U251, and U373, and PTEN-proficient LN18 and LN428 glioma cells after exposure to IR. These cells exhibited different cellular responses, senescence or apoptosis, depending on the PTEN status. We further observed that PTEN-deficient U87 cells with high levels of both AKT activation and intracellular reactive oxygen species (ROS) underwent senescence, whereas PTEN-proficient LN18 cells entered apoptosis. ROS were indispensable for inducing senescence in PTEN-deficient cells, but not for apoptosis in PTEN-proficient cells. Furthermore, transfection with wild-type (wt) PTEN or AKT small interfering RNA induced a change from premature senescence to apoptosis and depletion of p53 or p21 prevented IR-induced premature senescence in U87 cells. Our data indicate that PTEN acts as a pivotal determinant of cell fate, regarding senescence and apoptosis in IR-exposed glioma cells. We conclude that premature senescence could have a compensatory role for apoptosis in the absence of the tumor suppressor PTEN through the AKT/ROS/p53/p21 signaling pathway.


Figures

Figure 1
Figure 1
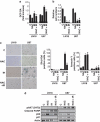
Phosphatase and tensin homolog status determines different cellular responses to ionizing radiation (IR). The PTEN-deficient or -proficient glioma cell lines were treated with IR at 6, 8, or 10 Gy. Relative cell numbers (a), SA-β-Gal activities (b), and trypan blue and Annexin V-positive cells (c) were quantified after 3 days or indicated days (for Annexin V positivity). Cells were photographed under phase contrast microscopy and cell numbers were counted in hemocytometer under a microscope. (d) Western blot analyses of p21 and cleaved PARP. Actin was detected as a loading control. Quantitative results are presented as mean±S.D. of three independent experiments. Significantly different: *P<0.01 versus control (C) or C at indicated days. mt, mutant; wt, wild type
Figure 2
Figure 2
Phosphatase and tensin homolog (PTEN)-deficient glioma cells activate the apoptotic pathway after treatment with doxorubicin, but enter premature senescence after ionizing radiation (IR) exposure. The PTEN-deficient or -proficient glioma cell lines were treated with 20 or 40 Gy of IR, and 10 or 20 μg/ml of doxorubicin. Cellular morphologies (upper panel) and relative cell numbers (lower panel) (a), SA-β-Gal activities (b), and Annexin V-positive cells (c) were quantified after 3 days or 10 and 24 h (for Annexin V positivity). Cells were photographed under phase contrast microscopy and cell numbers were counted in hemocytometer under a microscope. (d) Western blot analyses of p21 and cleaved PARP. Actin was detected as a loading control. Each bar in the graphs indicates mean±S.D. of three independent experiments. Significantly different: *P<0.01 versus C
Figure 3
Figure 3
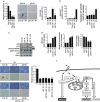
Cellular responses to ionizing radiation (IR) differ between PTEN-deficient U87 and PTEN-proficient LN18 cells. U87 and LN18 cells were treated with 8 Gy of IR and were analyzed as indicated at 1, 2, and 3 days post treatment. Relative cell numbers (left panel) and SA-β-Gal activities (middle and right panels) (a) and Annexin V-positive cells (b) were assessed at indicated time intervals. Cells were photographed under phase contrast microscopy 3 days after treatment and cell numbers were counted in hemocytometer under a microscope. (c) Western blot analyses using the antibodies indicated in the figure. Actin was detected as a loading control. (d) Intracellular ROS were measured by flow cytometry after DCF-DA staining (left panel), and mitochondrial superoxide was measured by fluorescence with MitoSOX Red (right panel). Western blot analyses were performed using the antibodies indicated in the figure (middle panel). Quantitative results are presented as mean±S.D. of three independent experiments. Significantly different: *P<0.01 versus C at indicated days for Figure 3a and b; *P<0.01 versus C for Figure 3d
Figure 4
Figure 4
Ionizing radiation (IR)-induced premature senescence, but not apoptosis, requires ROS accumulation. The U87 and LN18 cells were treated with 8 Gy of IR and were analyzed as indicated after 3 days in the presence or absence of 10 mM NAC. (a) Intracellular ROS were measured by flow cytometry after DCF-DA staining. (b) Relative cell numbers were counted in hemocytometer under a microscope. (c) Cellular morphologies (left panel), SA-β-Gal activities (middle panel), and percentage of Annexin V-positive cells (right panel). Cellular morphologies were observed under phase contrast microscopy and cell numbers were counted in hemocytometer under a microscope. (d) Western blot analysis using the antibodies indicated in the figure. Actin was detected as a loading control. Each bar in the graphs indicates mean±S.D. of three independent experiments. Significantly different: *P<0.01 versus C, **P<0.01 versus IR, insignificantly different: P>0.01 versus C, #P>0.01 versus IR
Figure 5
Figure 5
Wild-type (wt) PTEN expression shifts the IR response from senescence to apoptosis in U87 cells. The U87 cells were transfected with wt PTEN or empty vector (EV) followed by treatment with 8 Gy IR. (a) Relative cell numbers (left panel), cellular morphologies (middle panel), and SA-β-Gal activities (middle and right panels) were analyzed at 3 days after IR exposure. (b) Apoptotic cells were assessed by Annexin V positivity and caspase-3/7 activity at 3 days after IR exposure. (c) Intracellular ROS levels were measured by flow cytometry after DCF-DA staining at 2 days after IR exposure. (d) Western blot analysis using the antibodies indicated in the figure. Actin was detected as a loading control. Each bar in the graphs indicates mean±S.D. of three independent experiments. Significantly different: *P<0.01 versus EV, **P<0.01 versus EV + IR, ***P<0.01 versus wt PTEN
Figure 6
Figure 6
Depletion of AKT shifts the IR response from senescence to apoptosis in U87 cells. The U87 cells were transfected with AKT siRNA or control siRNA followed by treatment with 8 Gy IR. (a) Relative cell numbers (left panel), cellular morphologies (middle panel), and SA-β-Gal activities (middle and right panels) analyzed at 3 days after IR exposure. (b) Percentages of Annexin V-positive cells and caspase-3/7 activity. Annexin V positivity and caspase-3/7 activity were assessed 2 and 4 days or 3 days after treatment, respectively. (c) Intracellular ROS levels were measured by flow cytometry after DCF-DA staining 2 days after IR exposure. (d) Western blot analysis using the antibodies indicated in the figure. Actin was detected as a loading control. Con, control; si, siRNA. Each bar in the graphs indicates mean±S.D. of three independent experiments. Significantly different: *P<0.01 versus Con si, **P<0.01 versus Con si + IR, ***P<0.01 versus AKT si
Figure 7
Figure 7
Knockdown of p53 inhibits IR-induced premature senescence. The U87 cells were transfected with p53 siRNA or control siRNA before 8 Gy of IR exposure. (a) Relative cell numbers (left panel) and SA-β-Gal activities (middle and right panels) were quantified 4 days after IR exposure. (b) Percentage of Annexin V-positive cells and caspase-3/7 activity analyzed 3 days after treatment. (c) Western blot analysis using the antibodies indicated in the figure. Actin was detected as a loading control. (d) Intracellular ROS levels (left panel), mitochondrial superoxide levels (middle panel), and relative BrdU incorporation (right panel) were measured 3 days after IR exposure. Intracellular ROS were measured by flow cytometry after DCF-DA staining, and mitochondrial superoxide was measured by fluorescence with MitoSOX Red. Con, control; si, siRNA; PC, positive control (U87 cells treated with doxorubicin 10 μg/ml for 24 h). Quantitative results are presented as mean±S.D. of three independent experiments. Significantly different: *P<0.01 versus Con si, **P<0.01 versus Con si + IR, insignificantly different (?): #P>0.01 versus Con si + IR
Figure 8
Figure 8
Knockdown of p21 inhibits IR-induced premature senescence. The U87 cells were transfected with p21 siRNA or control siRNA before 8 Gy of IR exposure. (a) Relative cell numbers (left panel) and SA-β-Gal activities (middle and right panels) were quantified 4 days after IR exposure. (b) Percentages of Annexin V-positive cells and caspase-3/7 activity analyzed at 3 days after IR exposure. (c) Western blot analysis using the antibodies indicated in the figure. Actin was detected as a loading control. (d) Intracellular ROS levels (left panel), mitochondrial superoxide levels (middle panel), and relative BrdU incorporation (right panel) were measured 3 days after IR exposure. Intracellular ROS were measured by flow cytometry after DCF-DA staining, and mitochondrial superoxide was measured by fluorescence with MitoSOX Red. (e) Cellular morphologies and SA-β-Gal activities (left panel) and relative cell numbers (right panel) in U87 cells, which were transfected with p53 siRNA or p21 siRNA in the presence or absence of p27 siRNA followed by treatment with 8 Gy IR. Cellular morphologies were observed under phase contrast microscopy and cell numbers were counted in hemocytometer under a microscope at 3 days after IR exposure. Con, control; si, siRNA; PC, positive control (U87 cells treated with doxorubicin 10 μg/ml for 24 h). (f) A model illustrating the role of PTEN in switching the cell fate between premature senescence and apoptosis by IR. Quantitative results are presented as mean±S.D. of three independent experiments. Significantly different: *P<0.01 versus Con si, insignificantly different: #P>0.01 versus Con si + IR for Figure 8a–d, #P>0.01 versus p21 si + IR for Figure 8e, ##P>0.01 versus p53 si + IR for Figure 8e

References

    1. Hirose Y, Berger MS, Pieper RO. Abrogation of the Chk1-mediated G(2) checkpoint pathway potentiates temozolomide-induced toxicity in a p53-independent manner in human glioblastoma cells. Cancer Res. 2001;61:5843–5849. - PubMed
    1. Ohgaki H, Dessen P, Jourde B, Horstmann S, Nishikawa T, Di Patre PL, et al. Genetic pathways to glioblastoma: a population-based study. Cancer Res. 2004;64:6892–6899. - PubMed
    1. Bleeker FE, Lamba S, Zanon C, van Tilborg AA, Leenstra S, Troost D, et al. Absence of AKT1 mutations in glioblastoma. PLoS One. 2009;4:e5638. - PMC - PubMed
    1. Keniry M, Parsons R. The role of PTEN signaling perturbations in cancer and in targeted therapy. Oncogene. 2008;27:5477–5485. - PubMed
    1. Nogueira V, Park Y, Chen CC, Xu PZ, Chen ML, Tonic I, et al. Akt determines replicative senescence and oxidative or oncogenic premature senescence and sensitizes cells to oxidative apoptosis. Cancer Cell. 2008;14:458–470. - PMC - PubMed

Publication types

MeSH terms

Substances