. 2011 Apr;18(4):700-11.
doi: 10.1038/cdd.2010.144. Epub 2010 Nov 12.

Chemotherapy overcomes TRAIL-R4-mediated TRAIL resistance at the DISC level

Affiliations

Chemotherapy overcomes TRAIL-R4-mediated TRAIL resistance at the DISC level

A Morizot et al. Cell Death Differ. 2011 Apr.

Abstract

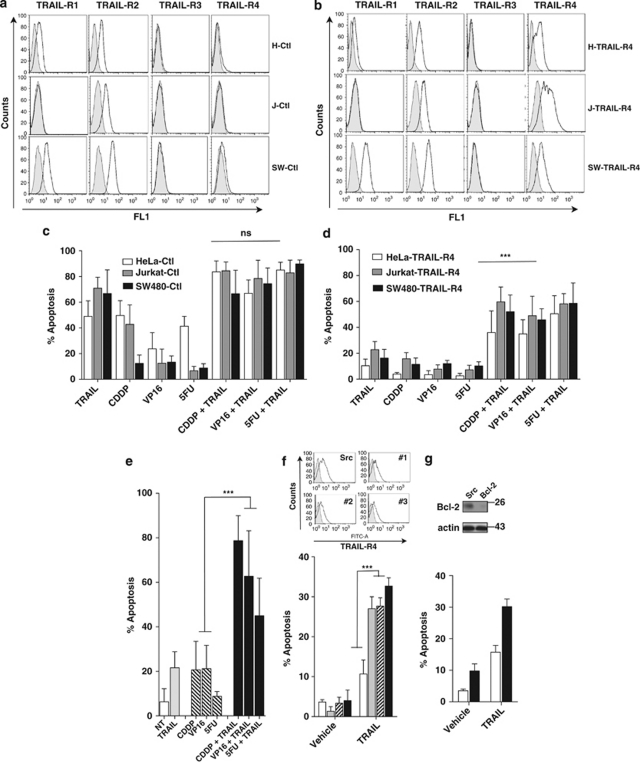
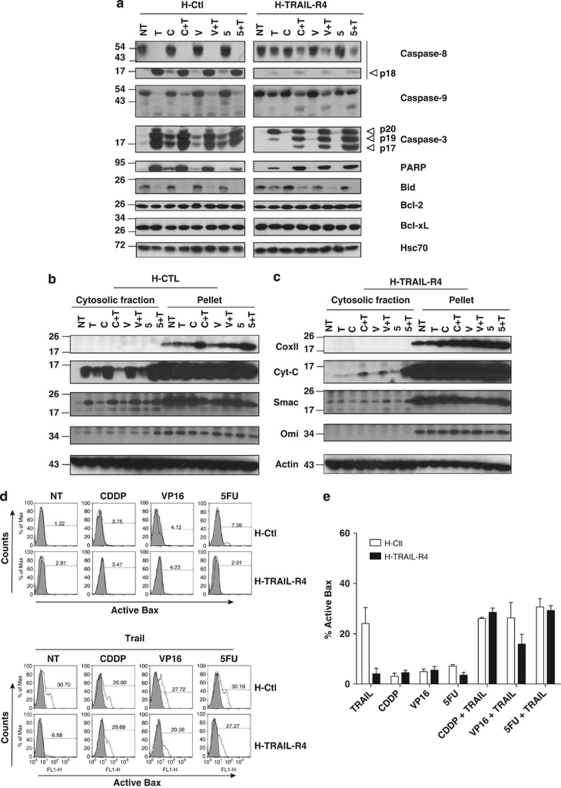
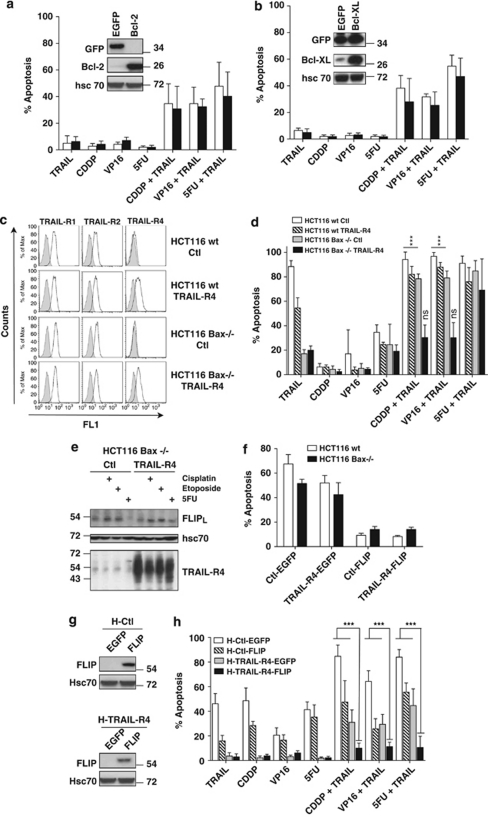
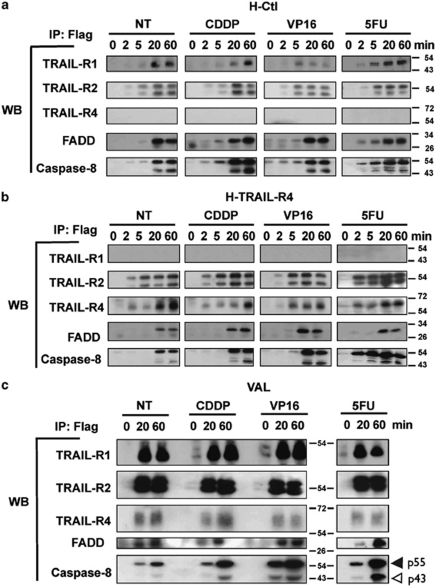
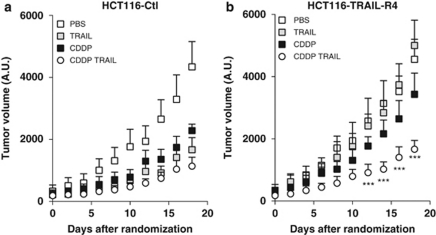
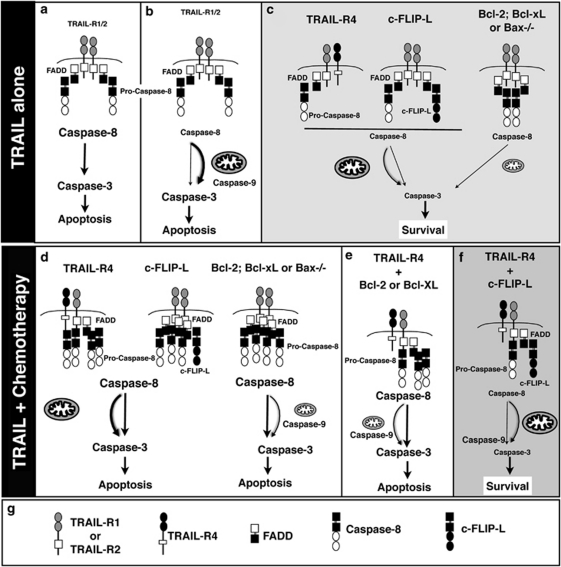
TNF-related apoptosis-inducing ligand or Apo2L (Apo2L/TRAIL) is a promising anti-cancer drug owing to its ability to trigger apoptosis by binding to TRAIL-R1 or TRAIL-R2, two membrane-bound receptors that are often expressed by tumor cells. TRAIL can also bind non-functional receptors such as TRAIL-R4, but controversies still exist regarding their potential to inhibit TRAIL-induced apoptosis. We show here that TRAIL-R4, expressed either endogenously or ectopically, inhibits TRAIL-induced apoptosis. Interestingly, the combination of chemotherapeutic drugs with TRAIL restores tumor cell sensitivity to apoptosis in TRAIL-R4-expressing cells. This sensitization, which mainly occurs at the death-inducing signaling complex (DISC) level, through enhanced caspase-8 recruitment and activation, is compromised by c-FLIP expression and is independent of the mitochondria. Importantly, TRAIL-R4 expression prevents TRAIL-induced tumor regression in nude mice, but tumor regression induced by TRAIL can be restored with chemotherapy. Our results clearly support a negative regulatory function for TRAIL-R4 in controlling TRAIL signaling, and unveil the ability of TRAIL-R4 to cooperate with c-FLIP to inhibit TRAIL-induced cell death.


Figures

Figure 1
Figure 1
Chemotherapeutic drugs restore TRAIL-induced cell death in TRAIL-R4-expressing cells. (a) and (b), HeLa, Jurkat or SW480 cancer cell lines were infected with empty vector (H-Ctl, J-Ctl or SW-Ctl) or with a vector encoding TRAIL-R4 (H-TRAIL-R4, J-TRAIL-R4 or SW-TRAIL-R4). Expression of TRAIL receptors was analyzed by flow cytometry (gray line) against an isotype control (filled curve). (c) and (d), control cells or TRAIL-R4-expressing cells were stimulated with His-TRAIL (500 ng/ml, 6 h), Cisplatin (CDDP, 20 μM, 3 h), etoposide (VP16, 10 μM, 3 h) or 5-fluorouracil (5FU, 1 μg/ml, 72 h). Apoptosis was evaluated after 6 h (TRAIL), 48 h (CDDP or VP16) or 72 h (5FU) by Hoechst staining in HeLa (white), Jurkat (gray) or SW480 (black). Sequential stimulation with chemotherapeutic drugs and TRAIL was performed as follows. Cells were pre-treated with CDDP or VP16 for 3 h, in serum-free medium, then washed and allowed to recover at 37 °C in complete medium for 48 h before stimulation with His-TRAIL (500 ng/ml) for an additional 6 h. Alternatively, cells were stimulated for 72 h with 5FU, then His-TRAIL for 6 h. (e) VAL cell sensitivity to His-TRAIL, chemotherapy or sequential treatments was analyzed as described above. (f) Deregulation of TRAIL-R4 expression in VAL cells using three different siRNAs (scramble siRNA, Src; TRAIL-R4 siRNA, #1, #2 and #3) as analyzed by Facs for TRAIL-R4 expression using an anti-TRAIL-R4 antibody (gray line) or a control isotype (filled curved). The effect of TRAIL-R4 downregulation was assessed by Hoechst staining 6 h after His-TRAIL treatment (500 ng/ml), scramble (white) and TRAIL-R4 siRNA (#1 gray; #2 dashed and #3 black). (g) Bcl-2 expression in VAL cells after transfection with the scramble siRNA (Src) or the Bcl-2 siRNA (Bcl-2) and corresponding Hoechst staining 6 h after His-TRAIL treatment (500 ng/ml), Bcl-2 siRNA (in black) or a scramble siRNA (in white). These results are representative of at least three independent experiments. Mean percentage of apoptotic cells and S.D. shown (mean±S.D.). Differences between selected groups were compared by non-parametric analysis of variance (ANOVA) with Bonferroni post hoc multiple comparison test, ***P<0.001. Molecular size markers are shown on the right in kDa
Figure 2
Figure 2
Chemotherapeutic drugs activate the mitochondrial apoptotic pathway. (a) Western blot analysis of caspase-8, caspase-9, and caspase-3, PARP, Bid, Bcl-2, Bcl-xL and hsc70 in control HeLa cells (H-Ctl) or cells expressing TRAIL-R4 (H-TRAIL-R4) after stimulation with His-TRAIL (T) and/or chemotherapeutic pretreatments with cisplatin (C), etoposide (V) or 5FU (5). White arrows indicate cleavage fragments. Molecular size markers are shown on the left in kDa. These results are representative of at least three independent experiments. (b) and (c) A digitonin-based permeabilisation experiment followed by western blot analysis of the different fractions (cytosolic or pellet) was performed to analyze the release of cytochrome c, Smac and Omi from the mitochondria. CoxII antibody was used as a control for efficient subcellular fractionation and the actin was probed for normalization. Control HeLa cells and H-TRAIL-R4 cells were treated as previously with cisplatin (C), etoposide (V) or 5-fluorouracil (5) plus or minus His-TRAIL (T). Molecular size markers are shown on the left in kDa. (d) Control HeLa cells and H-TRAIL-R4 cells were pre-treated as above with cisplatin (CDDP), etoposide (VP16) or 5-fluorouracil (5FU) then subsequently stimulated or not with His-TRAIL (TRAIL), as in Figure 1. After treatment, cells were permeabilized and stained with an antibody recognizing active Bax and analyzed by flow cytometry. (e) The percentage of cells containing active Bax was determined by FACS in control HeLa cells (H-Ctl, white bars) or TRAIL-R4-expressing cells (H-TRAIL-R4, black bars). These results are representative of at least three independent experiments. Mean %Active Bax values and S.D. are shown (mean±S.D.)
Figure 3
Figure 3
The mitochondrial pathway is dispensable for the synergy in TRAIL-R4 expressing HeLa cells. (a) H-TRAIL-R4 cells were infected using the pBabe-blasticidin retroviral vector encoding EGFP or Bcl-2. The expression of the different transgenes was checked by western blot using an anti-Bcl-2 or anti-GFP antibody. Hsc70 was used as a loading control. Molecular size markers are shown on the right in kDa. TRAIL-R4 HeLa cells overexpressing EGFP (EGFP, in white) or Bcl-2 (Bcl-2, in black) were pre-treated with the chemotherapeutic drugs as described in Figure 1 and sequentially treated with His-TRAIL (500 ng/ml for 6 h). Apoptosis was quantified by Hoechst staining. (b) H-TRAIL-R4 cells were infected with pMIG empty vector (EGFP) or pMIG-Bcl-xL and analyzed by western blot. Molecular size markers are shown on the right in kDa. Sensitivity to apoptosis induced by His-TRAIL, chemotherapy or sequential treatments (H-TRAIL-R4-EGFP, white; H-TRAIL-R4-Bcl-xL, black) was assessed by Hoechst staining. (c) HCT116 parental (HCT116 wt) and HCT116 Bax−/− cells were infected with an empty pMSCV-vector (HCT116 wt Ctl and HCT116 Bax−/− Ctl) or with pMSCV-vector encoding TRAIL-R4 (HCT116 wt TRAIL-R4 and HCT116 Bax−/− TRAIL-R4). Expression of TRAIL receptors was analyzed by flow cytometry. (d) Apoptosis induced by His-TRAIL (500 ng/ml, 6 h) after chemotherapeutic treatment was measured by Hoechst staining in HCT116 parental Bax wt Ctl (white), HCT116 wt overexpressing TRAIL-R4 (HCT116 wt TRAIL-R4, dashed), HCT116 Bax−/− Ctl (gray) and HCT116 Bax−/− overexpressing TRAIL-R4 cells (HCT116 Bax−/− TRAIL-R4, black). These results are representative of three independent experiments performed in triplicate. Mean percentage of apoptotic cells values and S.D. are shown (mean±S.D.). Differences between selected groups were compared by non-parametric analysis of variance (ANOVA) with Bonferroni post hoc multiple comparison test, ***P<0.001, compared with TRAIL stimulation alone in HCT116 Bax-deficient or HCT116 Bax-deficient expressing TRAIL-R4 cells, ns (not statistically significant). (e) Cells were stimulated as above for 3 h with treatments CDDP or VP16 or 72 h with 5FU, and c-FLIP or TRAIL-R4 expression was analyzed by western blotting 48 h or immediately after stimulation, respectively. Molecular size markers are shown on the left in kDa. (f) HCT116 Bax wt and Bax−/− control (Ctl) or TRAIL-R4 (TRAIL-R4) were infected with pMIG-FLIPL (FLIP) or an empty vector (EGFP), and sorted by flow cytometry based on GFP positivity. Sensitivity to TRAIL-induced apoptosis after a 72 h pre-treatment with 5FU was measured by Hoechst staining 6 h after His-TRAIL (500 ng/ml) treatment. (g) HeLa control (H-Ctl) and HeLa overexpressing TRAIL-R4 (H-TRAIL-R4) were infected with pBabe-EGFP or pBabe-FLIP. Expression of the different transgenes was checked by western blot. (h) Cells overexpressing EGFP (H-Ctl-GFP in white bars and H-TRAIL-R4-GFP in gray bars) or FLIP (H-Ctl-FLIP dashed bars and H-TRAIL-R4-FLIP in black bars) were stimulated with the chemotherapeutic agents, as described previously, and sequentially treated with His-TRAIL (500 ng/ml) for 6 h. Apoptotic cells were counted after Hoechst staining. These results are representative of at least three independent experiments. Mean percentage of apoptotic cells and S.D. are shown (mean±S.D.). Differences between selected groups were compared by non-parametric analysis of variance (ANOVA) with Bonferroni post hoc multiple comparison test. ***P<0.001, H-TRAIL-R4-FLIP compared with H-Ctl-Mock, H-Ctl-FLIP or H-TRAIL-R4-Mock
Figure 4
Figure 4
Chemotherapeutic drugs restore TRAIL sensitivity at the DISC level. (a) control HeLa cells (H-Ctl), (b) TRAIL-R4 expressing HeLa cells (H-TRAIL-R4) or (c) VAL cells were pre-treated with CDDP, VP16 or 5FU or left untreated as described in Figure 1, then stimulated with TRAIL for the indicated time. TRAIL DISC was immunoprecipitated (see Materials and Methods section) and analyzed by western blot. Molecular size markers are shown on the right in kDa
Figure 5
Figure 5
Chemotherapeutic drugs restore TRAIL sensitivity in vivo. (a) and (b), HCT116-Ctl or HCT116-TRAIL-R4 cells were implanted into NMRI nu/nu mice and allowed to reach 20 mm3. After randomization (day 0), mice were either injected with PBS (white squares), His-TRAIL alone at 8 mg/kg (gray squares), CDDP at 4 mg/kg (black squares) or sequentially with CDDP and 2 days later with His-TRAIL 8 mg/kg (white circle). Mice were subjected to two treatments spaced within 2 days. Tumors were measured every 2 days using a caliper. The combination was found statistically different from single treatments (***P<0.001) at days 14, 16, 18 and 20 as analyzed by ANOVA, two-sided. These results represent mean tumor volume in arbitrary units ±S.D. of 9 to 10 mice per group from three independent experiments
Figure 6
Figure 6
Proposed model of TRAIL-induced cell death regulation. (a) Direct activation of caspase-8 by TRAIL in type I cells. (b) A mitochondrial amplification loop of caspase activation in type II cells is required because of reduced caspase-8 activation upon TRAIL engagement. (c) Overexpression of TRAIL-R4, FLIP-L or mitochondrial block, protects type II cells from TRAIL-induced cell death. TRAIL-R4 and c-FLIP-L limit caspase-8 activation within the TRAIL DISC, which impairs mitochondrial activation, leading to low caspase-3 activation and survival. Mitochondrial block in type II cells, induced by Bcl-2 or Bcl-xL overexpression or Bax-deficiency inhibit amplification of the signal. Caspase-8 is activated but much less efficiently than in type I cells, leading to low caspase-3 activation and survival. (d) Chemotherapeutic drugs restore TRAIL sensitivity mainly through enhanced capase-8 recruitment to and activation at the DISC. Thus, the threshold of active caspase-8 required to induce direct caspase-3 activation can be reached and cells undergo apoptosis, overcoming TRAIL-R4- and c-FLIP-mediated inhibition of caspase-8, but also inhibition induced by Bcl-2 or Bcl-xL overexpression or Bax-deficiency. (e) Inhibition of the mitochondrial pathway by Bcl-2 or Bcl-xL overexpression in TRAIL-R4-expressing cells fails to compromise chemotherapy-induced sensitization to TRAIL. (f) Forced inhibition of caspase-8 activation in TRAIL-R4 and c-FLIP-L-expressing cells abrogates apoptosis induced by TRAIL after chemotherapy. (g) Schematic representation of TRAIL receptors, FADD, c-FLIP and caspase-8

References

    1. Ashkenazi A, Holland P, Eckhardt SG. Ligand-based targeting of apoptosis in cancer: the potential of recombinant human apoptosis ligand 2/Tumor necrosis factor-related apoptosis-inducing ligand (rhApo2L/TRAIL) J Clin Oncol. 2008;26:3621–3630. - PubMed
    1. Merino D, Lalaoui N, Morizot A, Solary E, Micheau O. TRAIL in cancer therapy: present and future challenges. Expert opin ther targets. 2007;11:1299–1314. - PMC - PubMed
    1. Berg D, Lehne M, Muller N, Siegmund D, Munkel S, Sebald W, et al. Enforced covalent trimerization increases the activity of the TNF ligand family members TRAIL and CD95L. Cell Death Differ. 2007;14:2021–2034. - PubMed
    1. Ganten TM, Haas TL, Sykora J, Stahl H, Sprick MR, Fas SC, et al. Enhanced caspase-8 recruitment to and activation at the DISC is critical for sensitisation of human hepatocellular carcinoma cells to TRAIL-induced apoptosis by chemotherapeutic drugs. Cell Death Differ. 2004;11 (Suppl 1:S86–S96. - PubMed
    1. Lacour S, Micheau O, Hammann A, Drouineaud V, Tschopp J, Solary E, et al. Chemotherapy enhances TNF-related apoptosis-inducing Ligand DISC assembly in HT29 human colon cancer cells. Oncogene. 2003;22:1807–1816. - PubMed

Publication types

MeSH terms

Substances