

Tracking Cholera in Coastal Regions using Satellite Observations
- PMID: 21072249
- PMCID: PMC2975368
- DOI: 10.1111/j.1752-1688.2010.00448.x
Tracking Cholera in Coastal Regions using Satellite Observations
Abstract
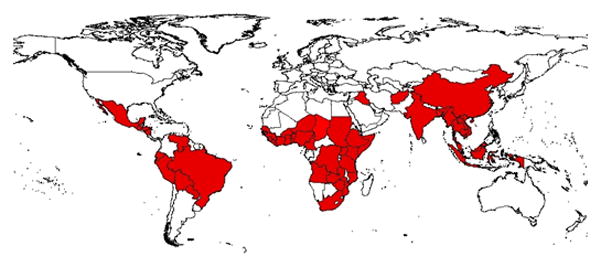
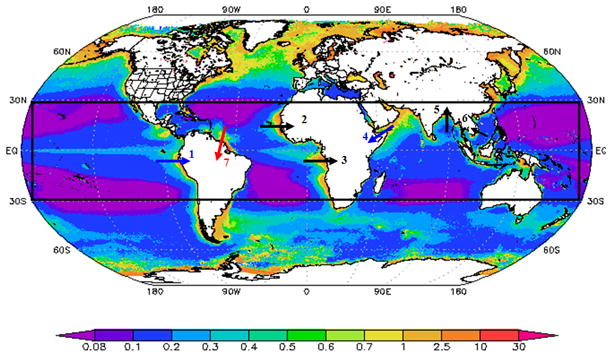
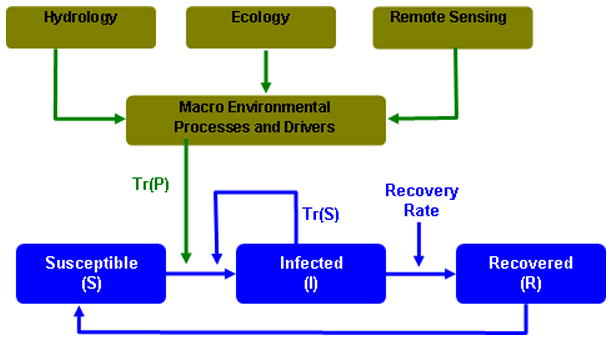
Cholera remains a significant health threat across the globe. The pattern and magnitude of the seven global pandemics suggest that cholera outbreaks primarily originate in coastal regions and then spread inland through secondary means. Cholera bacteria show strong association with plankton abundance in coastal ecosystems. This review study investigates relationship(s) between cholera incidence and coastal processes and explores utility of using remote sensing data to track coastal plankton blooms, using chlorophyll as a surrogate variable for plankton abundance, and subsequent cholera outbreaks. Most studies over the last several decades have primarily focused on the microbiological and epidemiological understanding of cholera outbreaks. Accurate identification and mechanistic understanding of large scale climatic, geophysical and oceanic processes governing cholera-chlorophyll relationship is important for developing cholera prediction models. Development of a holistic understanding of these processes requires long and reliable chlorophyll dataset(s), which are beginning to be available through satellites. We have presented a schematic pathway and a modeling framework that relate cholera with various hydroclimatic and oceanic variables for understanding disease dynamics using latest advances in remote sensing. Satellite data, with its unprecedented spatial and temporal coverage, have potentials to monitor coastal processes and track cholera outbreaks in endemic regions.
Figures
References
-
- Acker JG, Harding LW, Leptoukh G, Zhu T, Shen S. Remotely-sensed Chl-a at the Chesapeake Bay Mouth is Correlated with Annual Freshwater Flow to Chesapeake Bay. Geophys Res Lett. 2005;32:L05601. doi: 10.1029/2004GL021852. - DOI
-
- Akanda AS, Jutla AS, Islam S. Bimodal Cholera Transmission in Bengal Delta: A Hydroclimatological Explanation. Geophy Res Lett. 2009;36:L19401. doi: 10.1029/2009GL039312. - DOI
-
- Bentivoglio M, Pacini P. Filippo Pacini: A Determined Observer. Brain Res Bull. 1995;38(2):161–165. - PubMed
-
- Bertuzzo E, Azaele S, Maritan A, Gatto M, Rodriguez-Iturbe I, Rinaldo A. On the Space-Time Evolution of a Cholera Epidemic. Water Resour Res. 2008;44:W01424.
Grants and funding
LinkOut - more resources
Full Text Sources