

Speciated human high-density lipoprotein protein proximity profiles
- PMID: 21073165
- PMCID: PMC3006032
- DOI: 10.1021/bi1015452
Speciated human high-density lipoprotein protein proximity profiles
Abstract
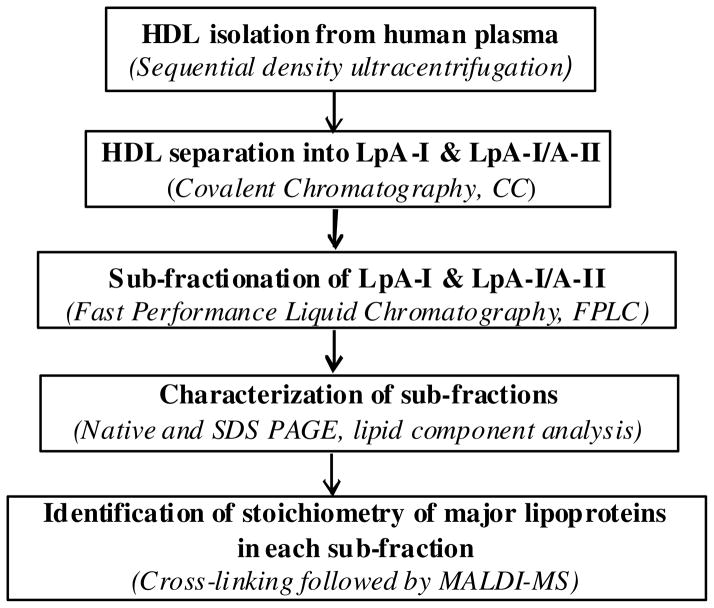
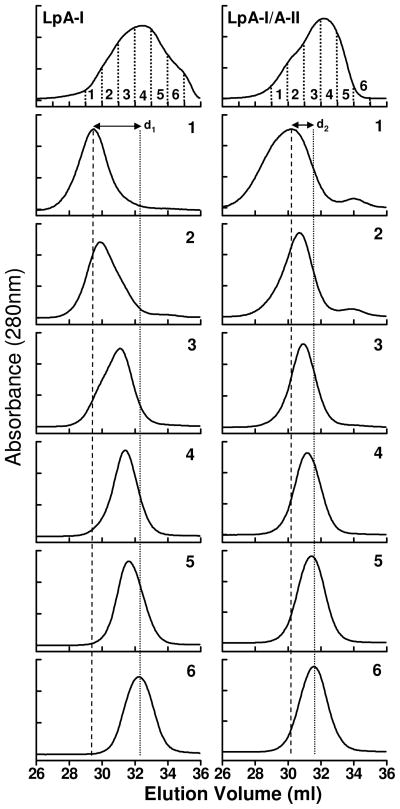
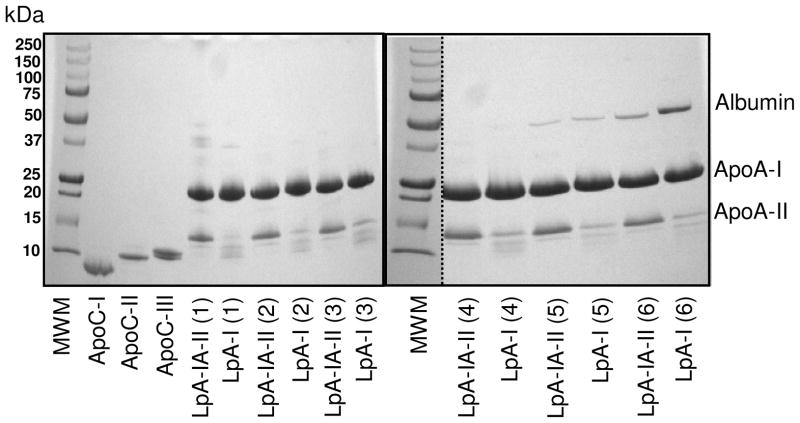
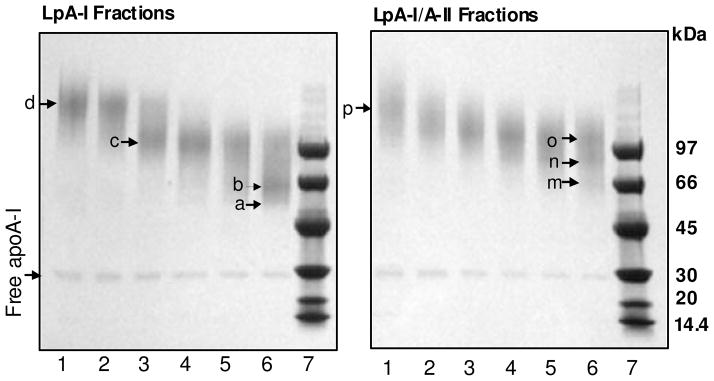
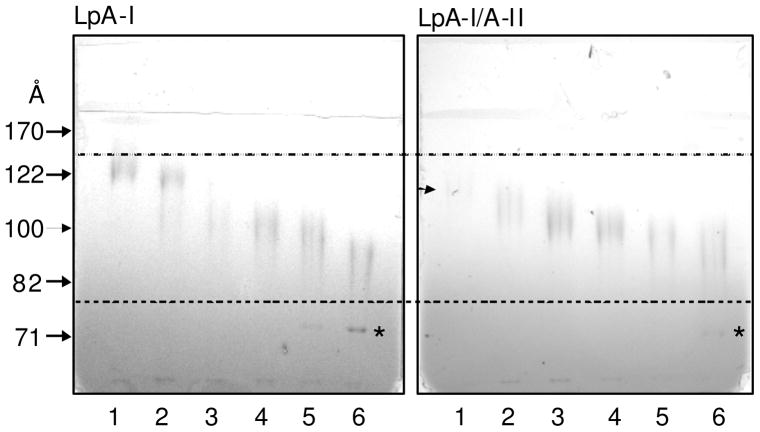
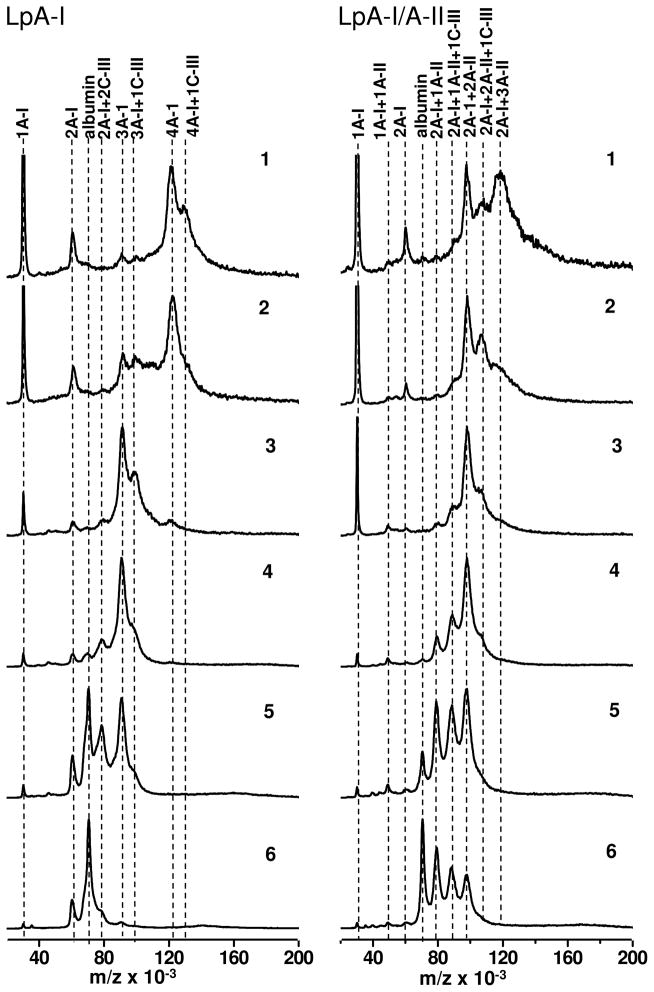
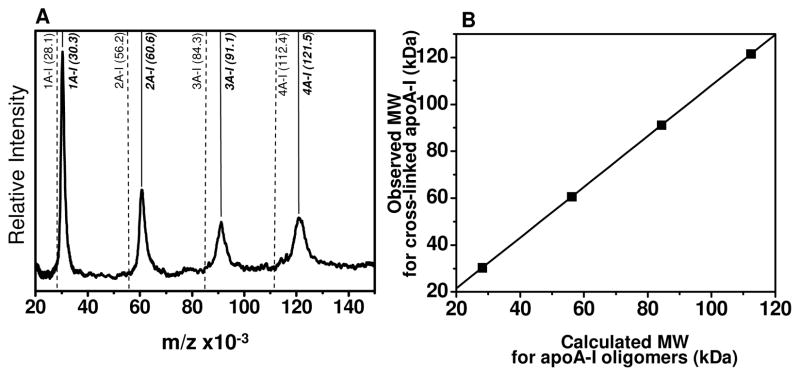
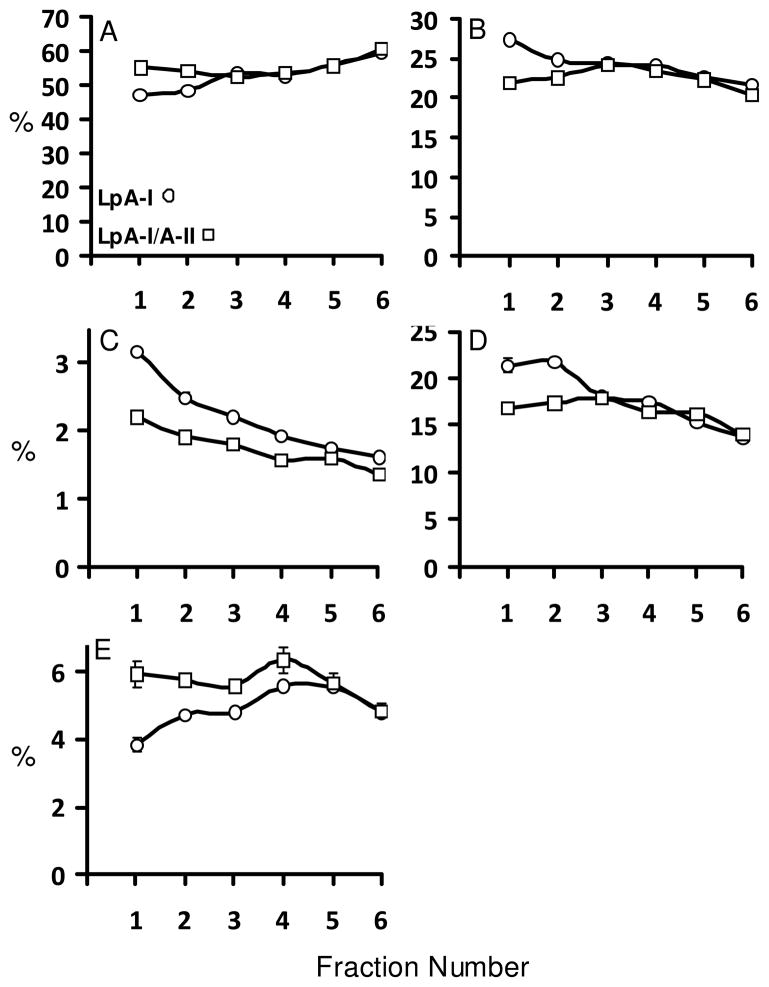
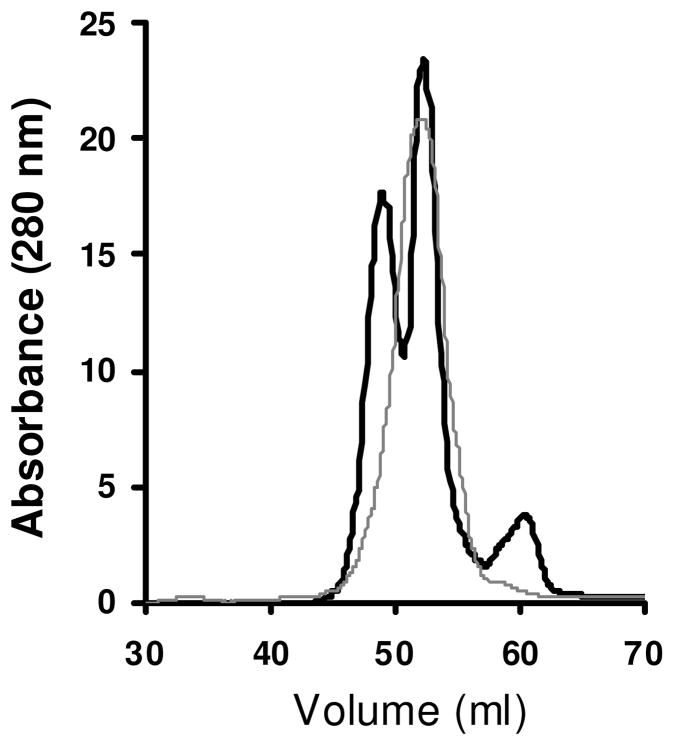
It is expected that the attendant structural heterogeneity of human high-density lipoprotein (HDL) complexes is a determinant of its varied metabolic functions. To determine the structural heterogeneity of HDL, we determined major apolipoprotein stoichiometry profiles in human HDL. First, HDL was separated into two main populations, with and without apolipoprotein (apo) A-II, LpA-I and LpA-I/A-II, respectively. Each main population was further separated into six individual subfractions using size exclusion chromatography (SEC). Protein proximity profiles (PPPs) of major apolipoproteins in each individual subfraction was determined by optimally cross-linking apolipoproteins within individual particles with bis(sulfosuccinimidyl) suberate (BS(3)), a bifunctional cross-linker, followed by molecular mass determination by MALDI-MS. The PPPs of LpA-I subfractions indicated that the number of apoA-I molecules increased from two to three to four with an increase in the LpA-I particle size. On the other hand, the entire population of LpA-I/A-II demonstrated the presence of only two proximal apoA-I molecules per particle, while the number of apoA-II molecules varied from one dimeric apoA-II to two and then to three. For most of the PPPs described above, an additional population that contained a single molecule of apoC-III in addition to apoA-I and/or apoA-II was detected. Upon composition analyses of individual subpopulations, LpA-I/A-II exhibited comparable proportions for total protein (∼58%), phospholipids (∼21%), total cholesterol (∼16%), triglycerides (∼5%), and free cholesterol (∼4%) across subfractions. LpA-I components, on the other hand, showed significant variability. This novel information about HDL subfractions will form a basis for an improved understanding of particle-specific functions of HDL.
Figures
Similar articles
-
Volumetric determination of apolipoprotein stoichiometry of circulating HDL subspecies.J Lipid Res. 2013 Oct;54(10):2733-44. doi: 10.1194/jlr.M039172. Epub 2013 Jul 23. J Lipid Res. 2013. PMID: 23883582 Free PMC article.
-
Relationship between low-density lipoprotein size and apolipoprotein A-I-containing particles: the ECTIM study.Eur J Clin Invest. 1997 Mar;27(3):242-7. doi: 10.1046/j.1365-2362.1997.1000644.x. Eur J Clin Invest. 1997. PMID: 9088861
-
Mass spectrometric determination of apolipoprotein molecular stoichiometry in reconstituted high density lipoprotein particles.J Lipid Res. 2009 Jun;50(6):1229-36. doi: 10.1194/jlr.D800044-JLR200. Epub 2009 Jan 28. J Lipid Res. 2009. PMID: 19179308 Free PMC article.
-
Human apolipoprotein A-II determines plasma triglycerides by regulating lipoprotein lipase activity and high-density lipoprotein proteome.Arterioscler Thromb Vasc Biol. 2010 Feb;30(2):232-8. doi: 10.1161/ATVBAHA.109.198226. Epub 2009 Nov 12. Arterioscler Thromb Vasc Biol. 2010. PMID: 19910634
-
Formation and metabolism of prebeta-migrating, lipid-poor apolipoprotein A-I.Arterioscler Thromb Vasc Biol. 2004 Mar;24(3):421-8. doi: 10.1161/01.ATV.0000104029.74961.f5. Epub 2003 Oct 30. Arterioscler Thromb Vasc Biol. 2004. PMID: 14592845 Review.
Cited by
-
Bioinformatic Analysis of Plasma Apolipoproteins A-I and A-II Revealed Unique Features of A-I/A-II HDL Particles in Human Plasma.Sci Rep. 2016 Aug 16;6:31532. doi: 10.1038/srep31532. Sci Rep. 2016. PMID: 27526664 Free PMC article.
-
Genetic Regulatory Networks of Apolipoproteins and Associated Medical Risks.Front Cardiovasc Med. 2022 Jan 6;8:788852. doi: 10.3389/fcvm.2021.788852. eCollection 2021. Front Cardiovasc Med. 2022. PMID: 35071357 Free PMC article. Review.
-
Solution structure of discoidal high-density lipoprotein particles with a shortened apolipoprotein A-I.Nat Struct Mol Biol. 2017 Feb;24(2):187-193. doi: 10.1038/nsmb.3345. Epub 2016 Dec 26. Nat Struct Mol Biol. 2017. PMID: 28024148
-
Volumetric determination of apolipoprotein stoichiometry of circulating HDL subspecies.J Lipid Res. 2013 Oct;54(10):2733-44. doi: 10.1194/jlr.M039172. Epub 2013 Jul 23. J Lipid Res. 2013. PMID: 23883582 Free PMC article.
-
Role of apolipoprotein A-II in the structure and remodeling of human high-density lipoprotein (HDL): protein conformational ensemble on HDL.Biochemistry. 2012 Jun 12;51(23):4633-41. doi: 10.1021/bi300555d. Epub 2012 Jun 1. Biochemistry. 2012. PMID: 22631438 Free PMC article.
References
-
- Barter P, Kastelein J, Nunn A, Hobbs R. High density lipoproteins (HDLs) and atherosclerosis; the unanswered questions. Atherosclerosis. 2003;168:195–211. - PubMed
-
- Ansell BJ, Watson KE, Fogelman AM, Navab M, Fonarow GC. High-density lipoprotein function recent advances. J Am Coll Cardiol. 2005;46:1792–1798. - PubMed
-
- Navab M, Ananthramaiah GM, Reddy ST, Van Lenten BJ, Ansell BJ, Fonarow GC, Vahabzadeh K, Hama S, Hough G, Kamranpour N, Berliner JA, Lusis AJ, Fogelman AM. The oxidation hypothesis of atherogenesis: the role of oxidized phospholipids and HDL. J Lipid Res. 2004;45:993–1007. - PubMed
-
- Curtiss LK, Valenta DT, Hime NJ, Rye KA. What is so special about apolipoprotein AI in reverse cholesterol transport? Arterioscler Thromb Vasc Biol. 2006;26:12–19. - PubMed
Publication types
MeSH terms
Substances
Grants and funding
LinkOut - more resources
Full Text Sources
Miscellaneous
