. 2010 Nov;4(6):334-47.
doi: 10.1049/iet-syb.2010.0006.

Shaping the response: the role of FcεRI and Syk expression levels in mast cell signaling

Affiliations

Shaping the response: the role of FcεRI and Syk expression levels in mast cell signaling

Ambarish Nag et al. IET Syst Biol. 2010 Nov.

Abstract

Many receptor systems initiate cell signaling through ligand-induced receptor aggregation. For bivalent ligands binding to mono- or bivalent receptors, a plot of the equilibrium concentration of receptors in aggregates against the log of the free ligand concentration, the cross-linking curve, is symmetric and bell shaped. However, steady state cellular responses initiated through receptor cross-linking may have a different dependence on ligand concentration than the aggregated receptors that initiate and maintain these responses. The authors illustrate by considering the activation of the protein kinase Syk that rapidly occurs after high affinity receptors for IgE, FcεRI, are aggregated on the surface of mast cells and basophils. Using a mathematical model of Syk activation the authors investigate two effects, one straightforward and one less so, that result in Syk activation not qualitatively following the cross-linking curve. Model predictions show that if the mechanism by which Syk is fully activated involves the transphosphorylation of Syk by Syk, then Syk activation curves can be either bell shaped or double humped, depending on the cellular concentrations of Syk and FcεRI. The model also predicts that the Syk activation curve can be non-symmetric with respect to the ligand concentration. The cell can exhibit differential Syk activation at two different ligand concentrations that produce identical distributions of receptor aggregates that form and dissociate at the same rates. The authors discuss how, even though it is only receptor aggregates that trigger responses, differences in total ligand concentration can lead to subtle kinetic effects that yield qualitative differences in the levels of Syk activation.


Figures

Figure 1
Figure 1
Receptor cross-linking (dimerization) curve fork+1 = 2.5 × 10⁷ M−1 s−1; k+2 = 8 × 10⁻⁹cm2s−1; k−1 = 0.316(10−0.5) s−1, k−2 = 0.0316(10−1.5) s−1. The receptor aggregation is maximum at L = 1/2K1, i.e. at log10(2K1L) = 0, where K1 = k+1/k−1 is the equilibrium constant for the extracellular bivalent ligand, present at concentration L, for binding to the Fab part of the IgE.
Figure 2
Figure 2
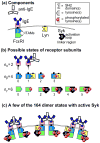
Components and states of the model, modified from of Faeder et al. [4]. The bivalent ligand is a monoclonal anti-IgE that can dimerize receptors.
Figure 3
Figure 3
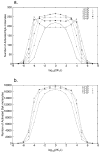
Syk Activation curves fork+1 = 2.5 × 10⁶ M−1s−1, k+2 = 8 × 10⁻⁹ cm2s−1, k−1 = k−2 = 0.01 s−1, and [Lyn]tot = 105 per cell. Each curve corresponds to a different number of receptors per cell given in the legend. The number of activated Syk molecules on the y axis are given in numbers per cell. (a) [Syk]tot = 5 × 10³ per cell; (b) [Syk]tot = 6 × 10⁴ per cell. The number of activated Syk molecules on the y axis are the numbers per cell. In (a) the ratio of total receptors to total Syk varies from 2–14 while in (b) the same ratio varies from 0.83–1.67.
Figure 4
Figure 4
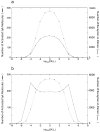
Comparison of receptor cross-linking and Syk activation curves to determine the type of antigen excess inhibition. k+1 = 2.5 × 10⁶M−1s−1, k+2 = 8 × 10⁻⁹ cm2s−1, k−1 = k−2 = 0.01 s−1; [Syk]tot = 5 × 10³ per cell; [Lyn]tot = 105 per cell. (a) [FcεRI]tot = 1 × 10⁴. The dashed line represents (Number of receptors in dimers)/20.0 and the solid line represents the number of activated Syk molecules. (b) [FcεRI]tot = 7 × 10⁴. The dashed line represents (Number of receptors in dimers)/250.0 and the solid line represents the number of activated Syk molecules.
Figure 5
Figure 5
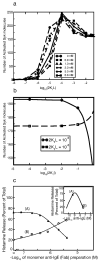
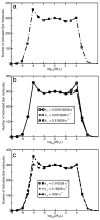
(a)The effect of adding different concentrations of a monovalent IgE ligand on the extent of Syk activation at 2K1L = 10−5 (Syk activation increases with 2K1L) and at 2K1L = 10−3 (Syk activation decreases with 2K1L). The concentration of monovalent inhibitor (Fab fragments when the ligand is anti-IgE) present in the simulation is given in the figure. (b) The variation of the extent of Syk activation as a function of the concentration per cell of a monovalent inhibitor, I, at two ligand concentrations given by 2K1L = 10−5 and 2K1L = 10−3. The ligand-receptor binding parameters used are k+1 = 2.5 × 10⁶ M−1s−1, k+2 = 8 × 10⁻⁹ cm2s−1, k−1 = k−2 = 0.01s−1. [Syk]tot = 5 × 10³ per cell; [Lyn]tot = 105 per cell; [FcεRI]tot = 105 per cell. (c) Modified Figure 1 from Magro and Alexander [20]. Plot of histamine release due to 5 × 10⁻¹⁰ M anti-IgE (A) and 5 × 10⁻⁸ M (B) incubated with increasing concentrations of monomer anti-IgE (Fab). The insert shows the positioning on the dose response curve of the two anti-IgE concentrations.
Figure 6
Figure 6
(a) Syk Activation curve for k+1 = 2.5 × 10⁷ M−1 s−1; k+2 = 8 × 10⁻⁹cm2s−1; k−1 = 0.316(10−0.5) s−1; k−2 = 0.0316(10−1.5)s−1; (b)–(c) Syk Activation curves for k+2 = 8 × 10⁻⁹cm2s−1; k−2 = 0.0316(10−1.5)s−1; (b)The k+1 and k−1 values are varied such that K1 = k+1/k−1 is fixed at 7.9 × 10⁷ M−1. The legends show the k−1 values used and the k+1 values are accordingly adjusted so that K1 remains fixed. For parts (a), (b) and (c), [Syk]tot = 7 × 10³ per cell; [Lyn]tot = 105 per cell; [FcεRI]tot = 105 per cell.
Figure 7
Figure 7
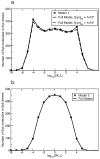
Comparison of number of Syk dimers per cell obtained using reduced model 1 and 2, with the corresponding numbers obtained using the full model. [Syk]tot = 7 × 10³ per cell; [FcεRI]tot = 105 per cell. We use the same ligand-receptor and Syk-p γ binding and unbinding parameters as in Table 2 for both the reduced models and the full model. (a) We consider two different total cellular concentrations of Lyn in the full model, [Lyn]tot = 105 and [Lyn]tot = 106 per cell. (b) Comparison of reduced model 2 to the full model when Lyn is in large excess and the rate of dephosphorylation is negligible ([Lyn]tot = 108 per cell, kp = 10−4s−1).
Figure 8
Figure 8
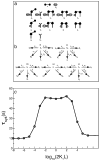
(a) Schematic representation of the different Syk containing species in the reduced model 1. We tag a particular Syk molecule and calculate the mean time required by this Syk molecule to be incorporated into a Syk dimer (d0). (b) (i–v) shows the different routes by which a tagged Syk molecule can be transferred from one species to another. (c) Mean time τSyk taken by any particular Syk molecule to be incorporated into a Syk dimer, starting as cytosolic Syk (s0) or as other specie(s) (a0, b0, c0, c1) in (a). The rate parameters are taken from Table. 2. [Syk]tot = 7 × 10³ per cell; [FcεRI]tot = 105 per cell.
Figure 9
Figure 9
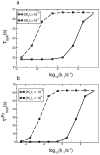
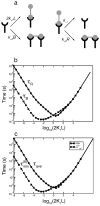
Variation withk−1 of (a) average time (τSyk) required by any particular Syk molecule to end up in a Syk dimer and (b) minimum time ( τmin(R)) required by a receptor to be incorporated into a receptor dimer, at ligand concentrations given by 2K1L = 10−4 and 2K1L = 104. The k−1 and k+1 are varied in such a way that K1 = k+1/k−1 remains fixed at 7.9 × 10⁷ M−1. Other rate constants are taken from Table 2. [Syk]tot = 7 × 10³ per cell; [FcεRI]tot = 105 per cell.
Figure 10
Figure 10
(a) Rate constants that characterize the transitions that a free receptor and a bound receptor not in an aggregate can undergo. (b) The mean times for a free receptor (τR) and a bound receptor (τB) to find a partner and form a dimer as a function of the bivalent ligand concentration. (c) The mean τave of τR and τB and the minimum τmin(R) of τR and τB as a function of the ligand concentration. In parts (b) and (c), the ligand receptor binding and cross-linking parameters are taken from Table 2 and [FcεRI]tot = 105 per cell.

Similar articles

Cited by

References

    1. Rivera J, Gilfillan AM. Molecular regulation of mast cell activation. J Allergy Clin Immunol. 2006;117:1214–1225. - PubMed
    1. MacGlashan D., Jr IgE and FcεRI regulation. Ann N Y Acad Sci. 2005;1050:73–88. - PubMed
    1. Blank U, Ra C, Miller L, White K, Metzger H, Kinet JP. Complete structure and expression in transfected cells of high affinity IgE receptor. Nature. 1989;337:187–189. - PubMed
    1. Faeder JR, Hlavacek WS, Reischl I, Blinov ML, Metzger H, Redondo A, et al. Investigation of Early Events in FcεRI-Mediated Signaling Using a Detailed Mathematical Model. J Immunol. 2003;170:3769–3781. - PubMed
    1. Kambayashi T, Koretzky GA. Proximal signaling events in FcεRI-mediated mast cell activation. J Allergy Clin Immunol. 2007;119:544–552. - PubMed

Publication types

LinkOut - more resources