. 2010 Nov 12:10:245.
doi: 10.1186/1471-2229-10-245.

The Vitis vinifera sugar transporter gene family: phylogenetic overview and macroarray expression profiling

Affiliations

The Vitis vinifera sugar transporter gene family: phylogenetic overview and macroarray expression profiling

Damien Afoufa-Bastien et al. BMC Plant Biol. .

Abstract

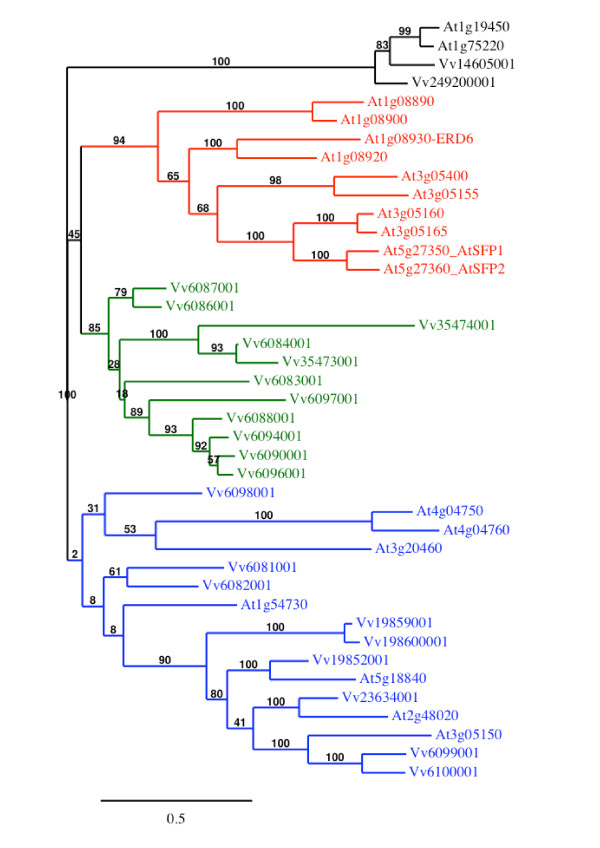
Background: In higher plants, sugars are not only nutrients but also important signal molecules. They are distributed through the plant via sugar transporters, which are involved not only in sugar long-distance transport via the loading and the unloading of the conducting complex, but also in sugar allocation into source and sink cells. The availability of the recently released grapevine genome sequence offers the opportunity to identify sucrose and monosaccharide transporter gene families in a woody species and to compare them with those of the herbaceous Arabidopsis thaliana using a phylogenetic analysis.

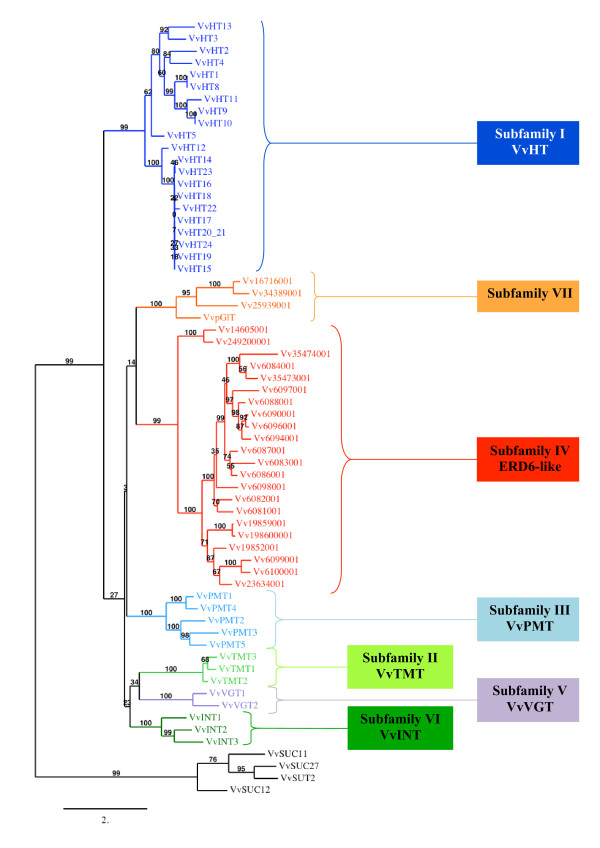
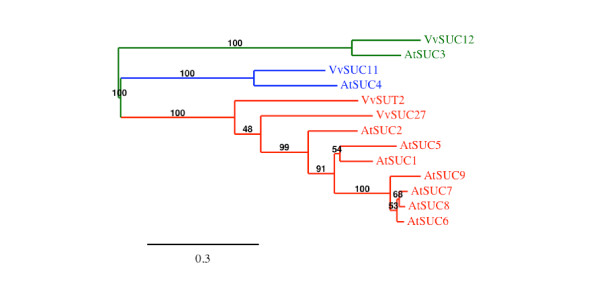
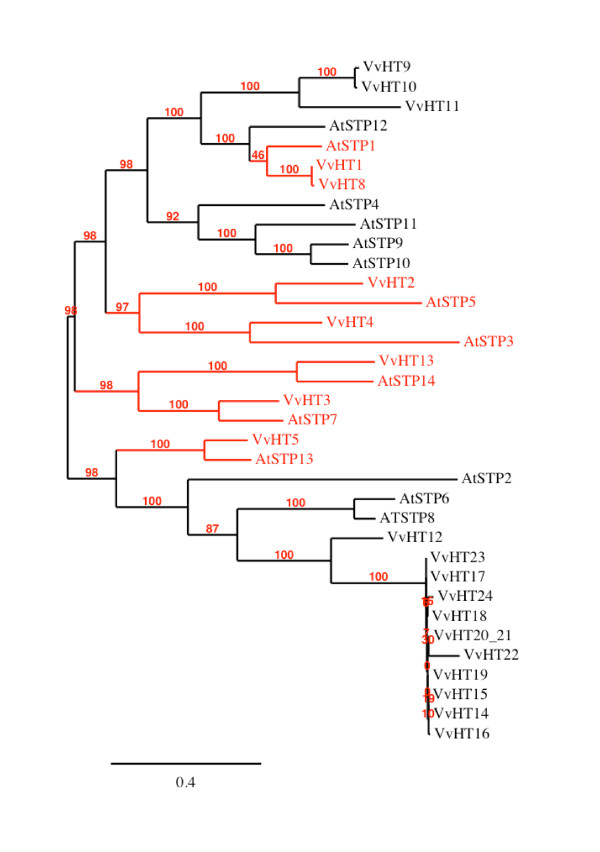
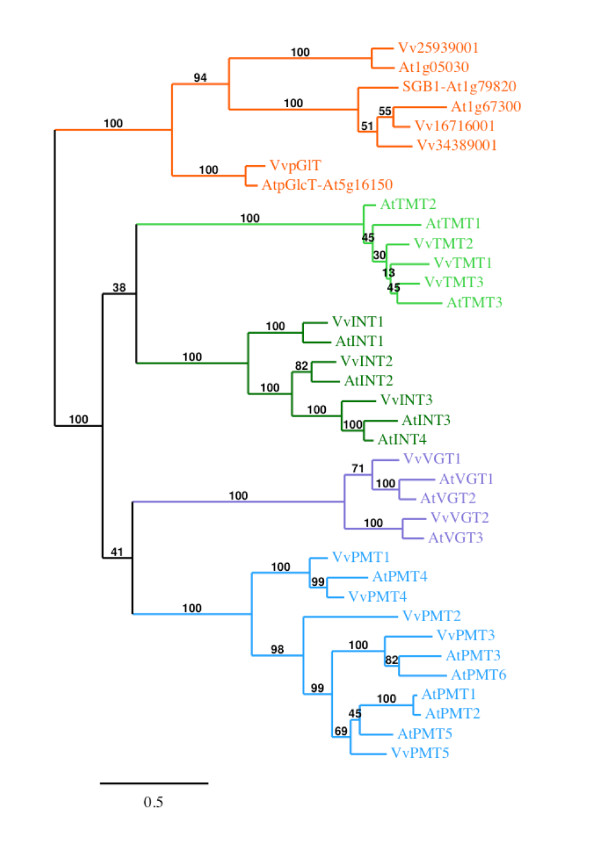
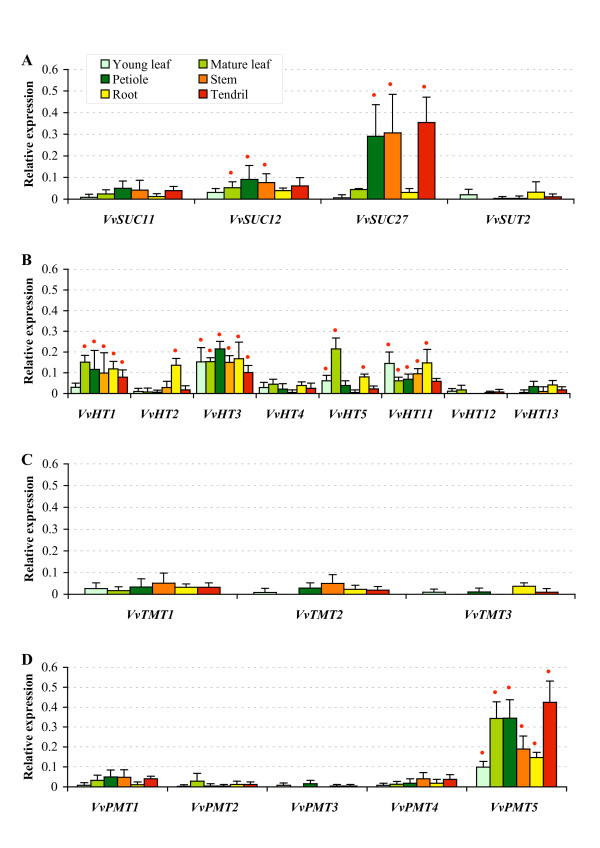
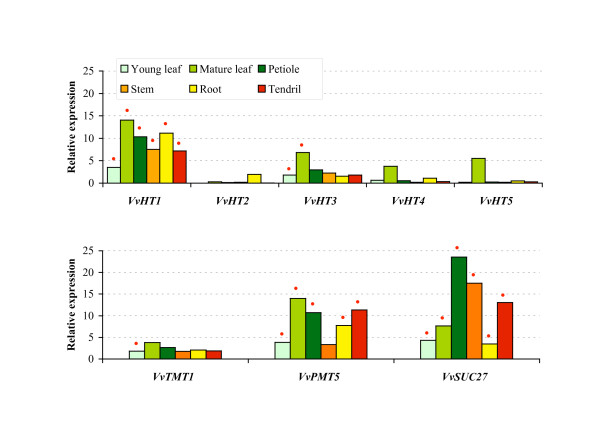
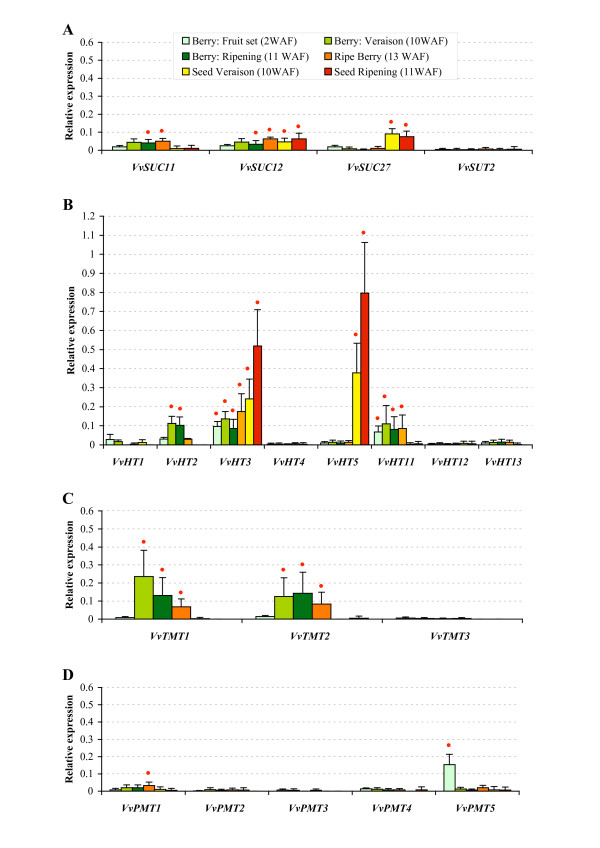
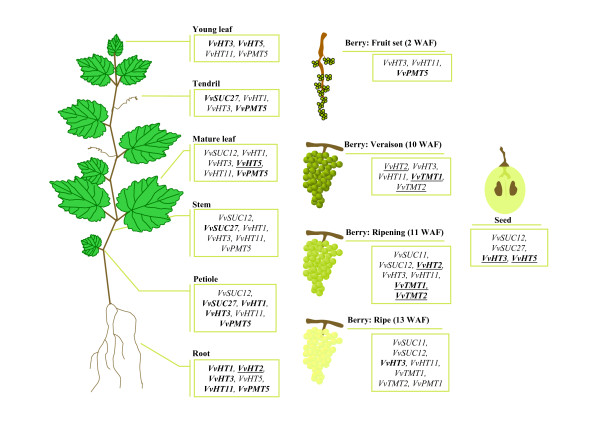
Results: In grapevine, one of the most economically important fruit crop in the world, it appeared that sucrose and monosaccharide transporter genes are present in 4 and 59 loci, respectively and that the monosaccharide transporter family can be divided into 7 subfamilies. Phylogenetic analysis of protein sequences has indicated that orthologs exist between Vitis and Arabidospis. A search for cis-regulatory elements in the promoter sequences of the most characterized transporter gene families (sucrose, hexoses and polyols transporters), has revealed that some of them might probably be regulated by sugars. To profile several genes simultaneously, we created a macroarray bearing cDNA fragments specific to 20 sugar transporter genes. This macroarray analysis has revealed that two hexose (VvHT1, VvHT3), one polyol (VvPMT5) and one sucrose (VvSUC27) transporter genes, are highly expressed in most vegetative organs. The expression of one hexose transporter (VvHT2) and two tonoplastic monosaccharide transporter (VvTMT1, VvTMT2) genes are regulated during berry development. Finally, three putative hexose transporter genes show a preferential organ specificity being highly expressed in seeds (VvHT3, VvHT5), in roots (VvHT2) or in mature leaves (VvHT5).

Conclusions: This study provides an exhaustive survey of sugar transporter genes in Vitis vinifera and revealed that sugar transporter gene families in this woody plant are strongly comparable to those of herbaceous species. Dedicated macroarrays have provided a Vitis sugar transporter genes expression profiling, which will likely contribute to understand their physiological functions in plant and berry development. The present results might also have a significant impact on our knowledge on plant sugar transporters.


Figures

Figure 1
Figure 1
Maximum likelihood phylogeny of Vitis vinifera sugar transporter proteins. The tree was produced using MUSCLE and PhyML with the JTT amino acid substitution model, a discrete gamma model with 4 categories and an estimated shape parameter of 1.213. Bootstrapping was performed with 100 replicates. For accession numbers of Vitis sugar transporter sequences see Additional file 1. Vitis ORFs names were simplified, Vv indicating GSVIVT000.
Figure 2
Figure 2
Maximum likelihood phylogeny of Vitis vinifera and Arabidopsis thaliana sucrose transporter proteins. The tree was produced using MUSCLE and PhyML with the JTT amino acid substitution model, a discrete gamma model with 4 categories and an estimated shape parameter of 0.872. Bootstrapping was performed with 100 replicates. Accession numbers for Arabidopsis thaliana transporters are: At1g71880 (AtSUC1), At1g22710 (AtSUC2), At2g02860 (AtSUC3), At1g09960 (AtSUC4), At1g71890 (AtSUC5), At5g43610 (AtSUC6), At1g66570 (AtSUC7), At2g14670 (AtSUC8), At5g06170 (AtSUC9); for Vitis ones see Additional file 1.
Figure 3
Figure 3
Maximum likelihood phylogeny of Vitis vinifera and Arabidopsis thaliana hexose transporter proteins. The tree was produced using MUSCLE and PhyML with the JTT amino acid substitution model, a discrete gamma model with 4 categories and an estimated shape parameter of 1.025. Bootstrapping was performed with 100 replicates. Accession numbers for Arabidopsis thaliana transporters are: At1g11260 (AtSPT1), At1g07340 (AtSTP2), At5g61520 (AtSTP3), At3g19930 (AtSTP4), At1g34580 (AtSTP5), At3g05960 (AtSTP6), At4g02050 (AtSTP7), At5g26250 (AtSTP8), At1g50310 (AtSTP9), At3g19940 (AtSTP10), At5g23270 (AtSTP11), At4g21480 (AtSTP12), At5g26340 (AtSTP13), At1g77210 (AtSTP14); for Vitis ones see Additional file 1.
Figure 4
Figure 4
Maximum likelihood phylogeny of Vitis vinifera and Arabidopsis thaliana monosaccharide transporter proteins. The tree was produced using MUSCLE and PhyML with the JTT amino acid substitution model, a discrete gamma model with 4 categories and an estimated shape parameter of 1.448. Bootstrapping was performed with 100 replicates. Accession numbers for Arabidopsis thaliana transporters are: At1g20840 (AtTMT1), At4g35300 (AtTMT2), At3g51490 (AtTMT3), At2g43330 (AtINT1), At1g30220 (AtINT2), At2g35740 (AtINT3), At4g16480 (AtINT4), At3g03090 (AtVGT1), At5g17010 (AtVGT2), At5g59250 (AtVGT3), At2g16120 (AtPMT1), At2g16130 (AtPMT2), At2g18480 (AtPMT3), At2g20780 (AtPMT4), At3g18830 (AtPMT5), At4g36670 (AtPMT6); for Vitis ones see Additional file 1. Vitis ORFs names were simplified, Vv indicating GSVIVT000.
Figure 5
Figure 5
Maximum likelihood phylogeny of Vitis vinifera and Arabidopsis thaliana ERD6-like transporter proteins. The tree was produced using MUSCLE and PhyML with the JTT amino acid substitution model, a discrete gamma model with 4 categories and an estimated shape parameter of 1.404. Bootstrapping was performed with 100 replicates. Arabidopsis transporters are indicated with complete ORFs names, for Vitis ones ORFs names were simplified, Vv indicating GSVIVT000.
Figure 6
Figure 6
Macroarray analysis of VvSUC/VvSUT (A), VvHT (B), VvTMT (C) and VvPMT (D) genes expression in grapevine vegetative organs. RNA was isolated from vegetative organs collected from 20 independent plants. Gene transcript levels were normalized against four reference genes (GAPDH, EF1α, EF1γ, actin). Each value represents the mean of six replicates obtained with two independent experiments. Red point indicates an expression value higher than the mean of the expression value for all genes in the tested organ (mean value of relative expression for young leaf: 0.03; mature leaf: 0.05; petiole: 0.07; stem: 0.05; root: 0.05; tendril: 0.07).
Figure 7
Figure 7
RNA gel blot analysis of V. vinifera sugar transporter genes transcript levels in vegetative organs. RNA was isolated from vegetative organs collected from 20 independent plants. Gene transcript levels were quantified using Image Quant 5.2 software and normalized against GAPDH gene expression. Red point indicates an expression value higher than the mean of the expression value for all genes in the tested organ (mean value of relative expression for young leaf: 1.65; mature leaf: 5.62; petiole: 6.01; stem: 3.55; root: 3.37; tendril: 4.10).
Figure 8
Figure 8
Macroarray analysis of VvSUC/VvSUT (A), VvHT (B), VvPMT (C), VvTMT (D) genes expression during grapevine berry and seed development. For each developmental stages, RNA was isolated from all berries collected from 5 independent grapes. Gene transcript levels were normalized against four reference genes (GAPDH, EF1α, EF1γ, actin). Each value represents the mean of six replicates obtained with two independent experiments.. Red point indicates an expression value higher than the mean of the expression value for all genes in the tested organ (mean value of relative expression for berry 2 WAF: 0.056; berry 10 WAF: 0.046; berry 11 WAF: 0.033; berry 13 WAF: 0.029; seed 10 WAF: 0.032; seed 11 WAF: 0.058).
Figure 9
Figure 9
Schematic representation of preferential expression of Vitis vinifera sugar transporter genes in the different vegetative organs and during berry development. This summary is based on the expression data described in the present report. For each organ, only genes with an expression value higher than the mean of the expression value for all genes are presented. Genes indicated in bold are the most expressed in the indicated organ. Underlined genes are those showing a preferential expression or being induced during the development of the considered organ.

References

    1. Lemoine R. Sucrose transporters in plants: update on function and structure. Biochim Biophys Acta. 2000;1465(1-2):246–262. doi: 10.1016/S0005-2736(00)00142-5. - DOI - PubMed
    1. Buttner M, Sauer N. Monosaccharide transporters in plants: structure, function and physiology. Biochim Biophys Acta. 2000;1465(1-2):263–274. doi: 10.1016/S0005-2736(00)00143-7. - DOI - PubMed
    1. Zimmermann MH, Ziegler. In: Encyclopedia of Plant Physiology. Zimmermann MH, Milbum JA, editor. Berlin: Springer Verlag; 1975. List of sugars and sugar alcohols in sieve-tube exudates; pp. 480–503.
    1. Weber A, Servaites JC, Geiger DR, Kofler H, Hille D, Groner F, Hebbeker U, Flugge UI. Identification, purification, and molecular cloning of a putative plastidic glucose translocator. Plant Cell. 2000;12(5):787–802. doi: 10.1105/tpc.12.5.787. - DOI - PMC - PubMed
    1. Martinoia E, Massonneau A, Frangne N. Transport processes of solutes across the vacuolar membrane of higher plants. Plant Cell Physiol. 2000;41(11):1175–1186. doi: 10.1093/pcp/pcd059. - DOI - PubMed

MeSH terms

LinkOut - more resources