. 2010 Nov 13:8:48.
doi: 10.1186/1476-7120-8-48.

WEB downloadable software for training in cardiovascular hemodynamics in the (3-D) stress echo lab

Affiliations

WEB downloadable software for training in cardiovascular hemodynamics in the (3-D) stress echo lab

Tonino Bombardini et al. Cardiovasc Ultrasound. .

Abstract

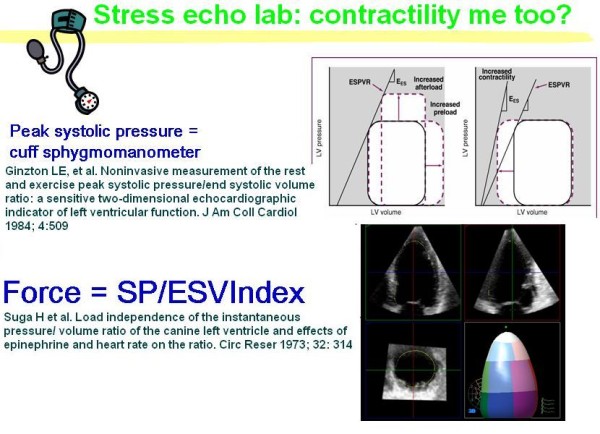
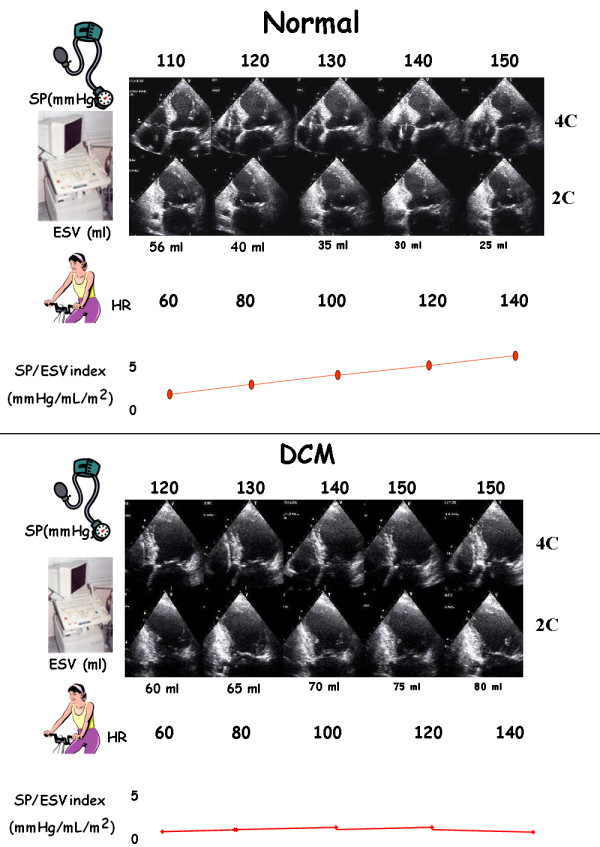
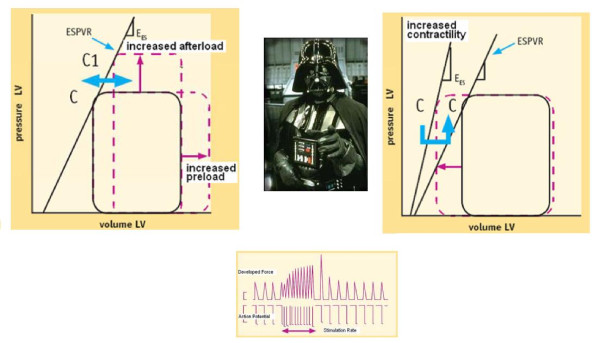
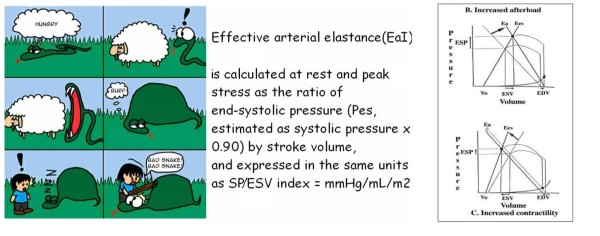
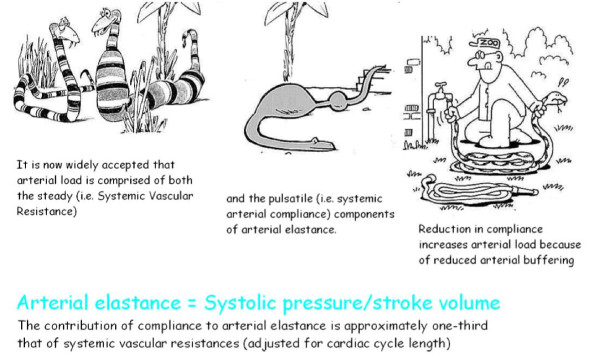
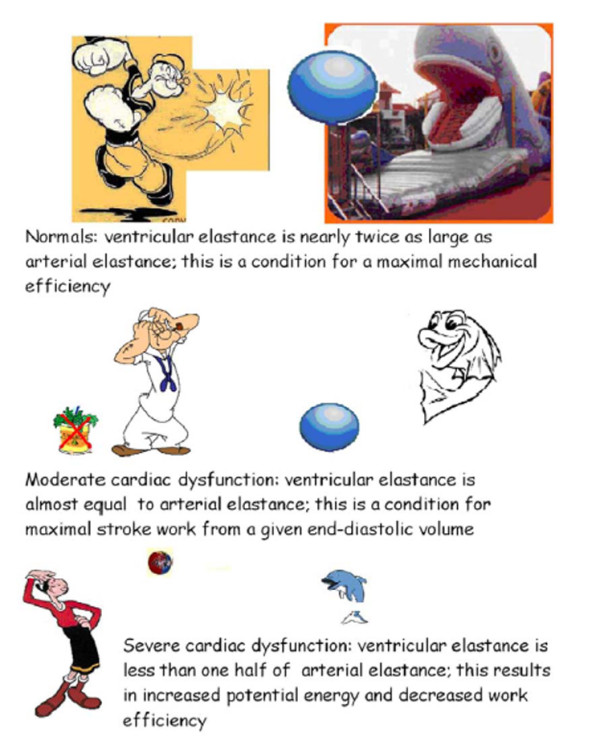
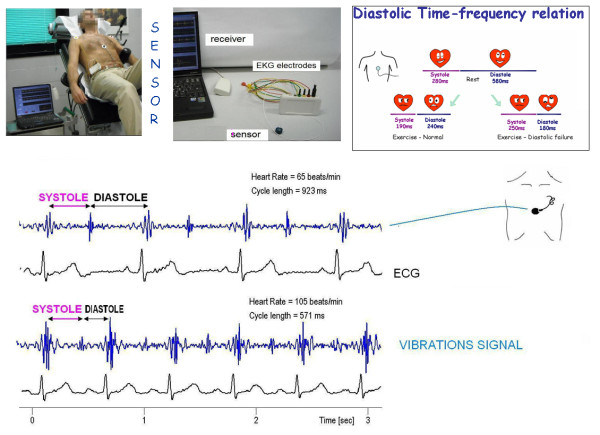
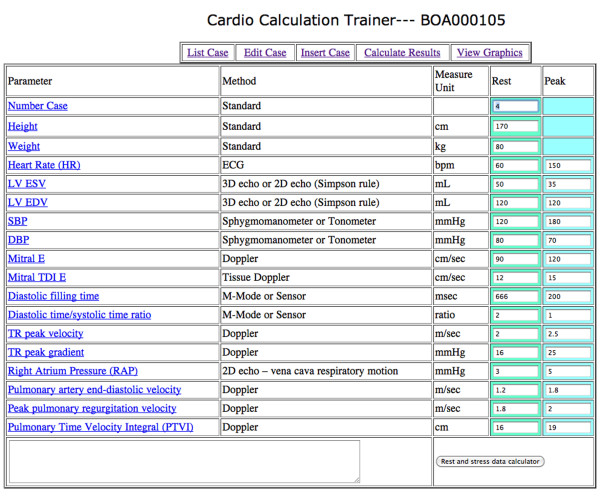
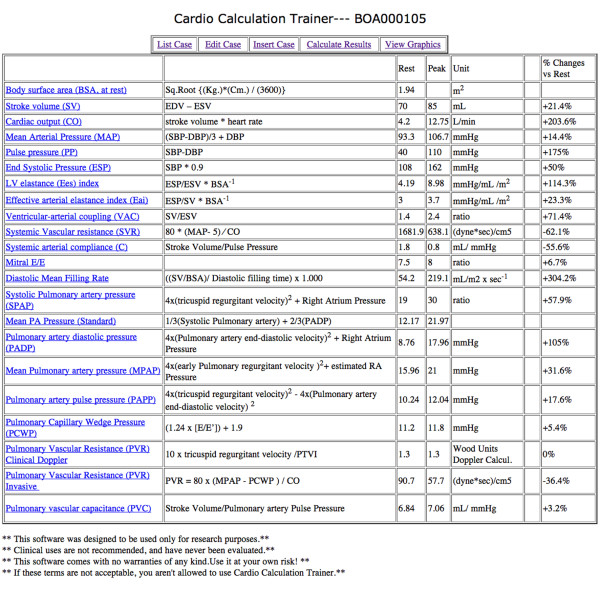
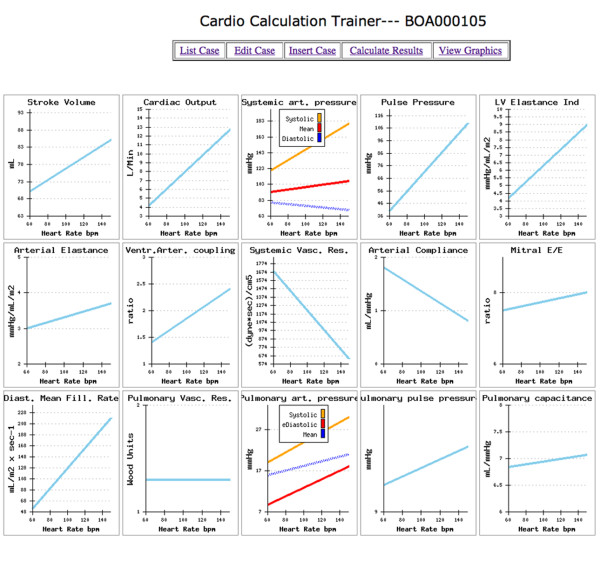
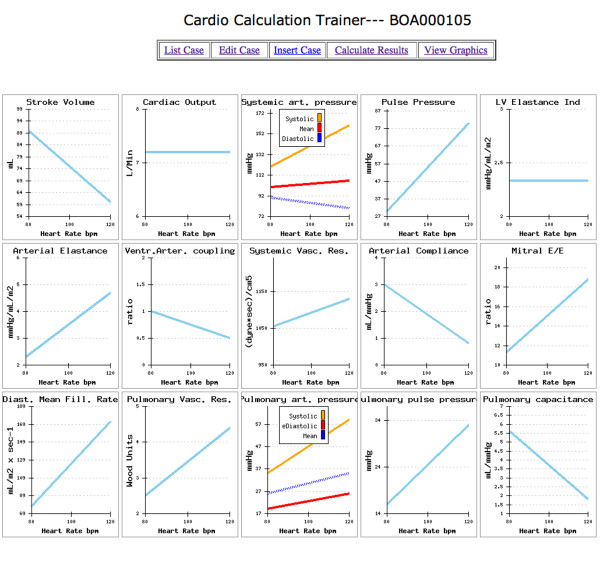
When a physiological (exercise) stress echo is scheduled, interest focuses on wall motion segmental contraction abnormalities to diagnose ischemic response to stress, and on left ventricular ejection fraction to assess contractile reserve. Echocardiographic evaluation of volumes (plus standard assessment of heart rate and blood pressure) is ideally suited for the quantitative and accurate calculation of a set of parameters allowing a complete characterization of cardiovascular hemodynamics (including cardiac output and systemic vascular resistance), left ventricular elastance (mirroring left ventricular contractility, theoretically independent of preload and afterload changes heavily affecting the ejection fraction), arterial elastance, ventricular arterial coupling (a central determinant of net cardiovascular performance in normal and pathological conditions), and diastolic function (through the diastolic mean filling rate). All these parameters were previously inaccessible, inaccurate or labor-intensive and now become, at least in principle, available in the stress echocardiography laboratory since all of them need an accurate estimation of left ventricular volumes and stroke volume, easily derived from 3 D echo. Aims of this paper are: 1) to propose a simple method to assess a set of parameters allowing a complete characterization of cardiovascular hemodynamics in the stress echo lab, from basic measurements to calculations 2) to propose a simple, web-based software program, to learn and training calculations as a phantom of the everyday activity in the busy stress echo lab 3) to show examples of software testing in a way that proves its value.The informatics infrastructure is available on the web, linking to http://cctrainer.ifc.cnr.it.


Figures

Figure 1
Figure 1
Stress echo lab: contractility me too?. Blood pressure analysis. One investigator records all blood pressures at rest and during exercise during the study. The blood pressure recording is made using a manometer sphygmomanometer and the diaphragm of a standard stethoscope. Echocardiography is performed using 3-D or conventional 2-D echocardiography and left ventricular end-systolic volume is measured. The contractility is determined at each stress step as the ratio of the systolic pressure (cuff sphygmomanometer)/end-systolic volume index (end-systolic volume/body surface area). Modified from Bombardini T. Myocardial contractility in the echo lab: molecular, cellular and pathophysiological basis. Cardiovascular ultrasound 2005, 3:27 [11].
Figure 2
Figure 2
Contractility changes with heart rate changes. The force-frequency relationship is defined up-sloping (upper panel) when the peak exercise SP/ESV index is higher than baseline and intermediate stress values; flat or negative (lower panel), when the peak exercise systolic pressure/end-systolic volume index is equal to or lower than baseline stress values. The critical heart rate (or optimum stimulation frequency) is defined as the heart rate at which systolic pressure/end-systolic volume index reaches the maximum value during progressive increase in heart rate.
Figure 3
Figure 3
Preload, afterload, heart rate: the dark side of the force. When a stress echo is scheduled, interest is focused on wall motion segmental contraction abnormality to diagnose ischemic response to stress and on LVEF to assess contractile reserve. However, ejection fraction is a very gross index of left ventricular performance. It is affected by pre-load and after-load changes and heart rate. Left panel. The graph shows how two additional pressure-volume loops appear with an acute increase in afterload or preload. Contractility is quantified by the end-systolic pressure volume relation slope: the Ees (end systolic elastance). Right panel. Increased contractility is reflected in higher myocardial fiber shortening velocity, with a more highly developed tension peak and a steeper pressure rise, when preload, after load, and heart rate are constant: the Ees (end systolic elastance) moves upward and to the left. Lower panel. Force-frequency relation or Bowditch treppe. In the healthy heart, a frequency increase up to 180 beats per minute provides for faster systolic calcium SR release (increased contractility or developed force) and for faster diastolic SR calcium reuptake (positive lusitropic effect).
Figure 4
Figure 4
Arterial elastance. In the cartoon (left panel) a compliant and no resistive young hungry snake eats a big sheep easily. In the cardiovascular system the hydraulic load, namely effective arterial elastance, is described by the formula: End Systolic Pressure/Stroke Volume/Body Surface Area (right panel). Intuitively a well compliant and no resistive vascular system easily accomplish a big stroke volume without great increase of systemic pressure: steady End Systolic Pressure/Stroke Volume ratio; "low-good" arterial elastance. Intuitively a bad compliant and resistive vascular system difficultly accomplish the stroke volume with greater increase of systemic pressure: increased End Systolic Pressure/Stroke Volume ratio; "high-bad" arterial elastance. On the basis of the windkessel model, effective arterial elastance Ea is a steady-state arterial parameter that incorporates peripheral resistance, characteristic impedance, and total lumped arterial compliance and that also incorporates systolic and diastolic time intervals. Since the pioneer work of Kelly et al. [38], which confirmed the clinical applicability of this concept in humans, effective arterial elastance Ea has been used to quantify arterial load during aging, in hypertensive patients, and in various forms of cardiac disease. Ees = left ventricular end-systolic elastance, ESV = end-systolic volume, ESP = end-systolic pressure, EDV = end-diastolic volume.
Figure 5
Figure 5
The steady (Systemic Vascular Resistance) and the pulsatile (Systemic Arterial Compliance) components of Arterial Elastance. In the cartoon (left panel) the skinny snake is a thin pipe with high strength, the snake stretched by food is a low resistance conduit. In the cartoon (middle panel) the compliant snake easily dilates itself and pushes the food at pulsatile waves. In the cartoon (right panel) the blind zoo guardian unsuccessfully try to use the snake tail (extremely resistive and no compliant) as a water conduct. Increased systemic vascular resistance and decreased total arterial compliance both contribute to the high arterial load in hypertensive patients.
Figure 6
Figure 6
Ventricular-arterial coupling. In the cartoon, arterial elastance is the "mouth" of the whale. Big mouth means low arterial elastance (no resistive and well compliant), able to easily accommodate large stroke volume energetically ejected; small fish mouth means higher arterial elastance (highly resistive and no compliant), able to accommodate only small stroke volume (low contractile-energy launched). Understanding the performance of the left ventricle (LV) requires not only examining the properties of the LV itself, but also investigating the modulating effects of the arterial system on left ventricular performance. Interaction of the LV with the arterial system, termed ventricular-arterial coupling, is a central determinant of cardiovascular performance and cardiac energetics. Ventricular arterial coupling is indexed by the ratio of left ventricular systolic elastance index (systolic pressure/end-systolic volume) to arterial elastance (Ea, ratio of end-systolic pressure by stroke volume). Although in the resting state ventricular-arterial coupling is maintained in a range that maximizes the efficiency of the heart, when the system is stressed, energy efficiency is sacrificed in favor of cardiac efficiency, manifested by an increase in the coupling index (i.e., a greater relative increase in ventricular contractility than arterial load). Ventricular arterial coupling is normally set toward higher left ventricular work efficiency, whereas in patients with moderate cardiac dysfunction, ventricular and arterial properties are matched to maximize stroke work at the expense of work efficiency.
Figure 7
Figure 7
The mechanical events in the cardiac cycle, assembled by Lewis in 1920 but first conceived by Wiggers in 1915. Cycle length of 800 milliseconds for 75 beats/min. Cardiological systole is demarcated by the interval between the first and the second heart sounds, lasting from the first heart sound to the closure of the aortic valve. The remainder of the cardiac cycle automatically becomes cardiological diastole. Left ventricular contraction: isovolumic contraction (b); maximal ejection (c). Let ventricular relaxation: start of relaxation and reduced ejection (d); isovolumic relaxation (e); LV filling rapid phase (f); slow LV filling (diastasis) (g); atrial systole or booster (a). Mitral valve closure occurs after the crossover point of atrial and ventricular pressures at the start of systole. A2 = aortic valve closure, aortic component of second sound; AO = aortic valve opening, normally inaudible; ECG = electrocardiogram; JVP = jugular venous pressure; M1 = mitral component of first sound at time of mitral valve closure; MO = mitral valve opening, may be audible in mitral stenosis as the opening snap; P2 = pulmonary component of second sound, pulmonary valve closure; S3 = third heart sound; S4 = fourth heart sound; T1 = tricuspid valve closure, second component of first heart sound. Modified from Opie LH. Mechanisms of cardiac contraction and relaxation. In: Braunwald E, Zipes DP, Libby P, Bonow RO, eds. Heart Disease. 7th ed. WB Saunders Company 2005, Chap.19:457-489, page 475.
Figure 8
Figure 8
Operator-independent cardiologic systole and diastole quantification. The transcutaneous force sensor is based on a linear accelerometer. We housed the device in a small case which is positioned in the mid-sternal precordial region and is fastened by a solid gel ECG electrode. The acceleration signal is converted to digital and recorded by a laptop PC, together with an ECG signal. An analog peak-to-peak detector synchronized with the standard ECG scans the first 150 ms following the R wave to record first heart sound force vibrations and the 100 ms following the T wave to record second heart sound force vibrations. A stable, reproducible, and consistent first heart sound and second heart sound signal is obtained and utilized as time markers to continuously assess cardiologic systole and diastole during exercise, or pharmacological stress echo. Modified from Bombardini et al. Cardiovascular Ultrasound 2008 6:15 [24]
Figure 9
Figure 9
Implementation of the computational training software. Opening a new example by the web linking to http://cctrainer.ifc.cnr.it. and clicking on "insert case" button a electronic sheet appears. Rest and peak data sets should be filled by the trainer in the fourth and fifth columns. After inserting the data, the operator clicks the "rest and stress data calculator" button to open the electronic calculation sheet. Each definition/abbreviation can be expanded to a full description simply pointing the mouse cursor.
Figure 10
Figure 10
Implementation of the computational training software. Once linked to http://cctrainer.ifc.cnr.it., after filling the "insert case sheet" and clicking on the "rest and stress data calculator" button, the calculation results sheet opens. Calculation algorithms are shown in column 2 and software calculated results appear in the third "rest" and in the fourth "peak "column". In the sixth column the trainer will find % rest-peak change values. Each definition/abbreviation can be expanded to a full description simply pointing the mouse cursor.
Figure 11
Figure 11
Training example with a "normal subject" data set. Clicking on the "view graphics" button opens the graph results sheet. For each calculated variable rest-peak changes are graphically displayed with heart rate values on the x-axis and variable value on the y-axis. LV elastance index at peak stress is nearly twice as large as arterial elastance index, with ventricular-arterial coupling normally set toward higher left ventricular work efficiency. Stroke volume increases through the use of the Frank-Starling mechanism and heart rate. Systemic vascular resistances drop markedly at peak exercise.
Figure 12
Figure 12
Training example with a "DCM subject" data set. Clicking on the "view graphics" button opens the graph results sheet. For each calculated variable rest-peak changes are graphically displayed with heart rate values on the x-axis and variable value on the y-axis. LV elastance index is markedly lower at peak exercise. At peak stress ventricular elastance index is less than one-half of the arterial elastance index, which results in decreased ventricular-arterial coupling and work efficiency. DCM patients display a vasoconstrictive response in peripheral circulation, with a modest and inconsistent decrease of SVR and a more marked drop of arterial compliance at peak stress.

References

    1. Picano E. Stress Echocardiography. 5. Springer-Verlag Berlin Heidelberg; 2009.
    1. Jacobs LD, Salgo IS, Goonewardena S, Weinert L, Coon P, Bardo D, Gerard O, Allain P, Zamorano JL, de Isla LP, Mor-Avi V, Lang RM. Rapid online quantification of left ventricular volume from real-time three-dimensional echocardiographic data. Eur Heart J. 2006;27:460–468. doi: 10.1093/eurheartj/ehi666. - DOI - PubMed
    1. Mor-Avi V, Sugeng L, Lang MR. Real-Time 3Dimensional Echocardiography: an integral component of the routine echocardiographic examination in adult patients? Circulation. 2009;119:314–29. doi: 10.1161/CIRCULATIONAHA.107.751354. - DOI - PubMed
    1. Delgado V, Bax JJ, Van Der Wall EE. Towards assessment of left ventricular mechanics in true three dimensions. Eur Heart J. 2009;30:554–55. - PubMed
    1. Nesser HJ, Mor-Avi V, Gorissen W, Weinert L, Steringer-Mascherbauer R, Niel J, Sugeng L, Lang RM. Quantification of left ventricular volumes using three-dimensional echocardiographic speckle tracking: comparison with MRI. Eur Heart J. 2009;30:1565–73. doi: 10.1093/eurheartj/ehp187. - DOI - PubMed

LinkOut - more resources