. 2010 Nov 12;143(4):527-39.
doi: 10.1016/j.cell.2010.10.016.

A model for neural development and treatment of Rett syndrome using human induced pluripotent stem cells

Affiliations

A model for neural development and treatment of Rett syndrome using human induced pluripotent stem cells

Maria C N Marchetto et al. Cell. .

Abstract

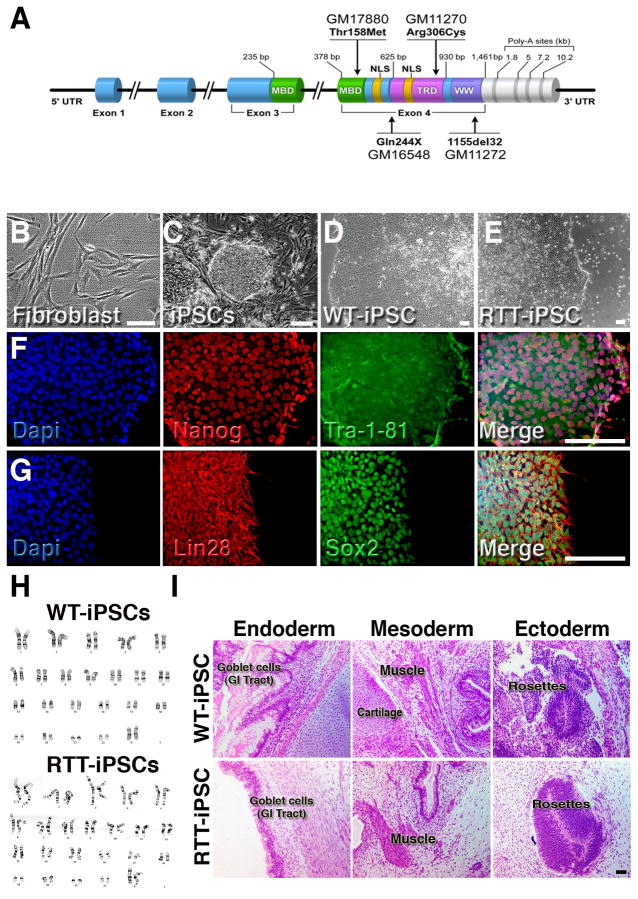
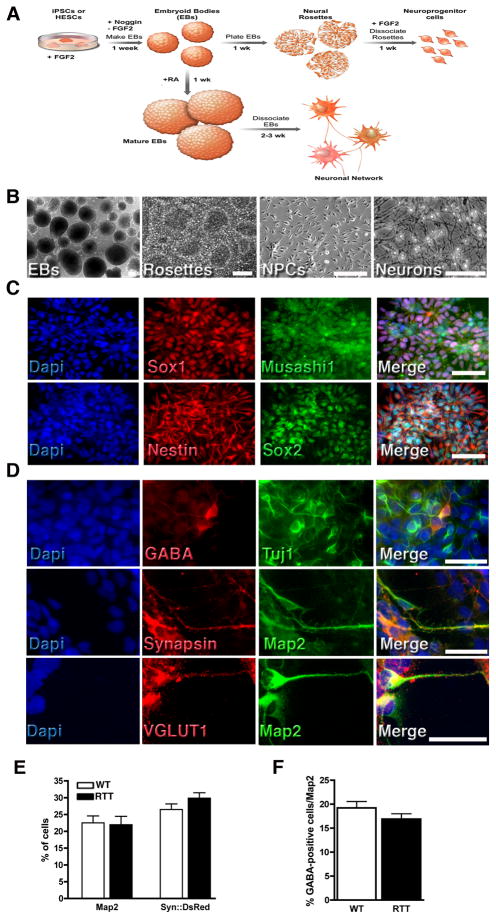
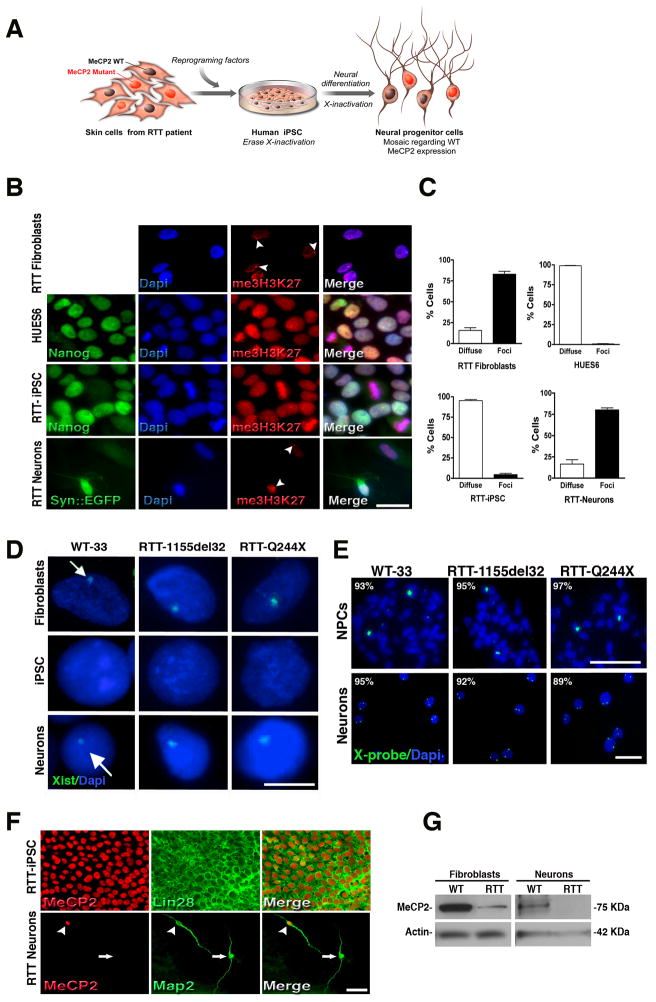
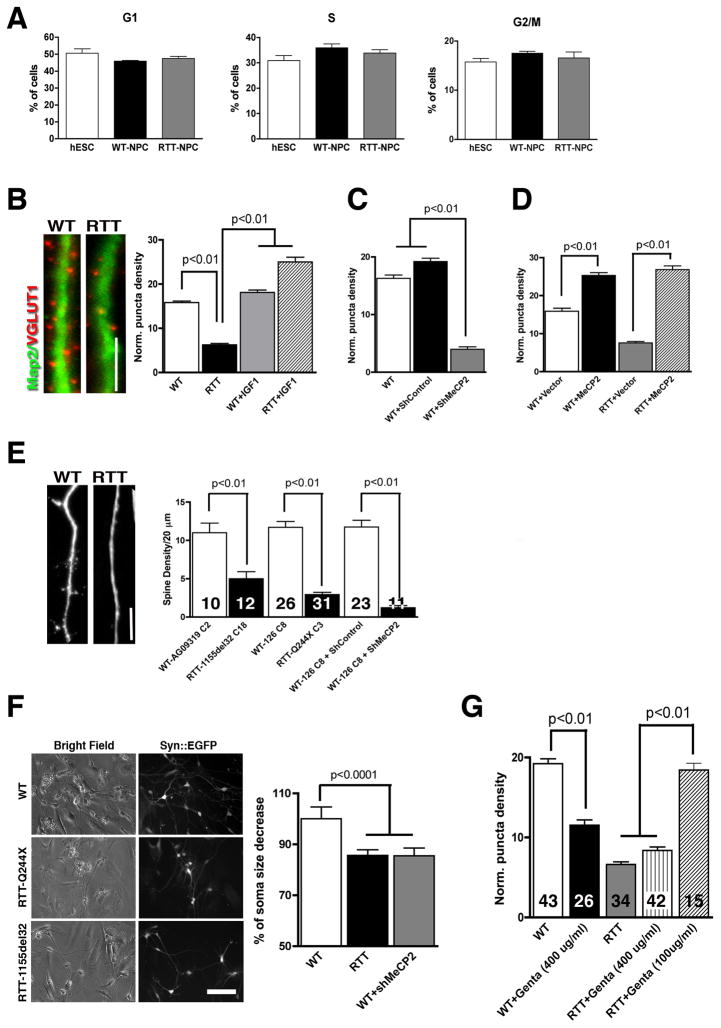
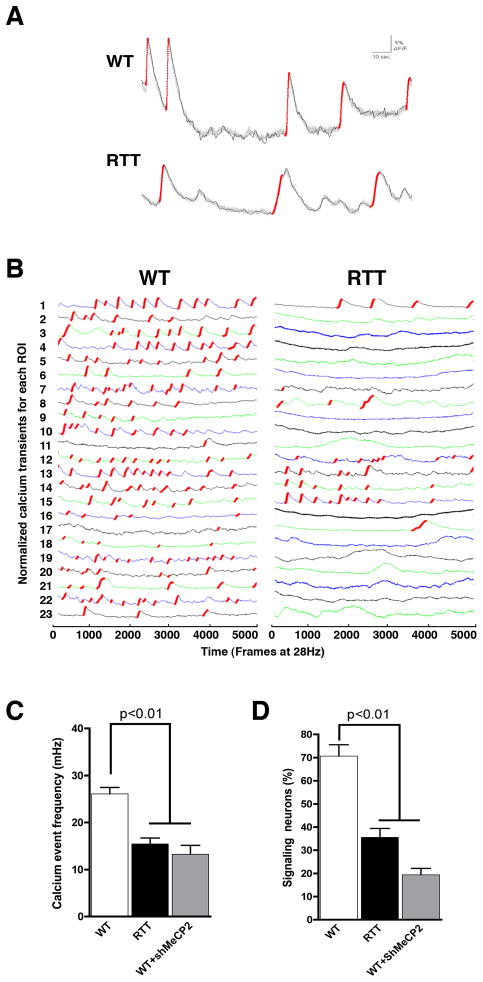
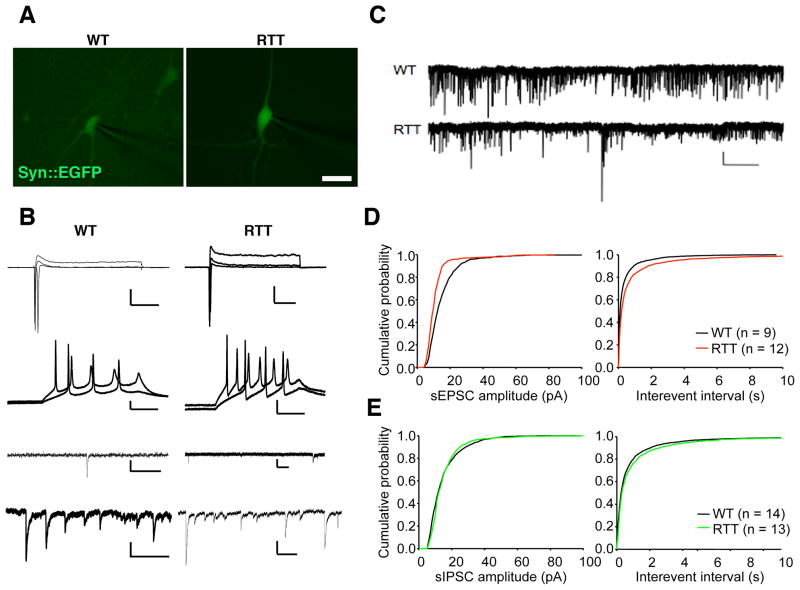
Autism spectrum disorders (ASD) are complex neurodevelopmental diseases in which different combinations of genetic mutations may contribute to the phenotype. Using Rett syndrome (RTT) as an ASD genetic model, we developed a culture system using induced pluripotent stem cells (iPSCs) from RTT patients' fibroblasts. RTT patients' iPSCs are able to undergo X-inactivation and generate functional neurons. Neurons derived from RTT-iPSCs had fewer synapses, reduced spine density, smaller soma size, altered calcium signaling and electrophysiological defects when compared to controls. Our data uncovered early alterations in developing human RTT neurons. Finally, we used RTT neurons to test the effects of drugs in rescuing synaptic defects. Our data provide evidence of an unexplored developmental window, before disease onset, in RTT syndrome where potential therapies could be successfully employed. Our model recapitulates early stages of a human neurodevelopmental disease and represents a promising cellular tool for drug screening, diagnosis and personalized treatment.


Conflict of interest statement

The authors declare no conflict of interest.

Figures

Figure 1
Figure 1
Generation of iPSCs. (A), Schematic representation of the MeCP2 gene structure and mutations used in this study. UTR, untranslated region; MBD, methyl-CpG binding domain; NLS, nuclear localization signal; Poly-A, polyadenylation signal; TRD, transcriptional repression domain; WW, domain-containing WW; X, stop codon. Respective cell lines codes are shown close to their mutations. (B), Morphology of human fibroblasts before retroviral infection. (C), Aspect of iPSCs colonies 14 days after infection. (D) and (E), Representative images of established iPSC colonies. (F) and (G), Representative images of RTT-iPSCs showing expression of pluripotent markers. (H), No karyotypic abnormalities were observed. (I), Representative images of teratoma sections. Bar = 100 μm. See also Figure S1.
Figure 2
Figure 2
Neural differentiation of iPSCs. (A), Schematic view of the neural differentiation protocol. (B), Representative images depicting morphological changes during neuronal differentiation. Bar = 100 μm. (C), NPCs are positive for neural precursor markers: Sox1, Sox2, Musashi1 and Nestin. Bar = 50 μm. (D), Representative images of cells after neuronal differentiation. iPSC-derived neurons express mature neuronal markers: GABA, Map2 and Synapsin. Bar = 20 μm. Similar numbers of Map2-positive and Syn::DsRed-positive (E) as well as GABA-positive (F) neurons from WT and RTT cultures. Data shown as mean ± s.e.m. See also Figure S2.
Figure 3
Figure 3
RTT-iPSC clones undergo X-inactivation during differentiation. (A), Schematic representation of X-inactivation dynamics during reprogramming and further neural differentiation. RTT fibroblasts are mosaic for the MeCP2 WT gene expression. During reprogramming, X-inactivation is erased and iPSCs express both MeCP2 alleles. Upon neuronal differentiation, X-inactivation is re-established and the resultant cells are mosaic for MeCP2 WT gene expression. (B), Immunofluorescence for me3H3K27 in fibroblasts, pluripotent cells (Nanog-positive) and after neuronal differentiation (Syn::EGFP-positive). Pluripotent cells (hESCs and iPSCs) show diffuse staining whereas differentiated cells (fibroblasts and neurons) exhibit prominent me3H3K27 nuclear foci (arrowheads). Cells were counterstained with Dapi. Bar = 15 μm. (C), Quantification of cells with diffused or foci me3H3K27 nuclear staining. Data shown as mean ± s.e.m. (D), RNA FISH shows that Xist RNA domains are present in the original fibroblasts before reprogramming. iPSCs show no Xist expression. Neurons derived from normal and RTT iPSCs show clear Xist clouds, indicating transcriptional silencing of the X chromosome (arrows). Bar = 5 μm. (E), Two DNA FISH signals are evident in the nuclei of iPSC-derived NPCs and neurons, revealing the presence of two X chromosomes. Bar = 10 μm. (F), RTT-iPSCs (1155del32) expressed WT MeCP2 but derived neurons displayed mosaicism regarding WT (arrowhead) and mutant (arrow) MeCP2 forms. Bar = 50 μm. (G), RTT-derived fibroblasts and neurons have reduced levels of WT MeCP2 protein by Western blot. See also Figure S3.
Figure 4
Figure 4
Alterations in RTT neurons. (A), Proliferating RTT NPCs displayed no signal of aberrant cell cycle when compared to controls. (B), Representative images of neurons showing VGLUT1 puncta on Map2 neurites. Bar graphs show synaptic density in RTT and WT neurons. IGF1 treatment increased VGLUT1 puncta number in RTT-derived neurons. Bar = 5 μm. (C), Reduction of MeCP2 expression decreased the number of glutamatergic synapses in WT neurons. (D), Overexpression of MeCP2 increased the number of glutamatergic synapses. (E), Representative images of neurites of different genetic backgrounds. Bar graph shows the spine density from independent experiments using different RTT backgrounds and controls and after expression of shMeCP2. Bar = 5 μm. (F), Representative images of neuronal cell body size. Bar graph shows the percentage of soma size decrease in RTT compared to WT neurons. Neuronal morphology was visualized using the Syn::EGFP lentiviral vector. Bar = 50 μm. (G), A lower dose of gentamicin was able to rescue glutamatergic synapses in RTT neurons. Numbers of neurons analyzed (n) are shown within the bars in graphs (E) and (G). For all clones and mutations used refer to Figure S4 and Table S2. Data shown as mean ± s.e.m.
Figure 5
Figure 5
Altered activity-dependent calcium transients in RTT-derived neurons. (A), Representative examples of WT and RTT calcium signal traces. Red traces correspond to the calcium rise phase detected by the algorithm used (see supplemental methods). (B), Fluorescence intensity changes reflecting intracellular calcium fluctuations in RTT and WT neurons in different Regions of Interest (ROI). (C), RTT neurons show a lower average of calcium spikes when compared to WT control neurons. (D), The percentage of Syn::DsRed-positive neurons signaling in the RTT neuronal network is significantly reduced when compared to controls. Data shown as mean ± s.e.m. See also Figure S5.
Figure 6
Figure 6
Decreased frequency of spontaneous postsynaptic currents in RTT neurons. (A), Fluorescence micrographs of representative WT and RTT neurons. Bar = 10 μm. (B), Electrophysiological properties of WT and RTT neurons. From top to bottom: Transient Na+ currents and sustained K+ currents in response to voltage step depolarizations (command voltage varied from −20 to +30 mV in 5 mV increments when cells were voltage-clamped at −70 mV, Bars = 400 pA and 50 ms). Action potentials evoked by somatic current injections (cells current-clamped at around −60 mV, injected currents from 10 to 40 pA, Bars = 20 mV and 100 ms), sEPSCs (Bars = right, 20 pA, 100 ms; left: 10 pA, 500 ms), and sIPSCs (Bars = right, 20 pA, 500 ms; left: 20 pA, 400 ms). (C), Sample 4-min recordings of spontaneous currents when the cells were voltage-clamped at −70 mV (Bars = 20 pA and 25 s). (D), Cumulative probability plot of amplitudes (left panel, 1 pA bins; p<0.001) and inter-event intervals (right panel, 20 ms bins; p<0.05) of sEPSCs from groups of WT (black) and RTT (red) cells, respectively. (E), Cumulative probability plot of amplitudes (left panel, 1 pA bins; p<0.05) and inter-event intervals (right panel, 20 ms bins; p<0.05) of sIPSCs from each group (WT, black; RTT, green).

Comment in

References

    1. Prevalence of autism spectrum disorders--autism and developmental disabilities monitoring network, six sites, United States. MMWR Surveill Summ. 2000;56:1–11. - PubMed
    1. Allen RC, Zoghbi HY, Moseley AB, Rosenblatt HM, Belmont JW. Methylation of HpaII and HhaI sites near the polymorphic CAG repeat in the human androgen-receptor gene correlates with X chromosome inactivation. Am J Hum Genet. 1992;51:1229–1239. - PMC - PubMed
    1. Amir RE, Van den Veyver IB, Wan M, Tran CQ, Francke U, Zoghbi HY. Rett syndrome is caused by mutations in X-linked MECP2, encoding methyl-CpG-binding protein 2. Nat Genet. 1999;23:185–188. - PubMed
    1. Ballas N, Lioy DT, Grunseich C, Mandel G. Non-cell autonomous influence of MeCP2-deficient glia on neuronal dendritic morphology. Nat Neurosci. 2009;12:311–317. - PMC - PubMed
    1. Chahrour M, Jung SY, Shaw C, Zhou X, Wong ST, Qin J, Zoghbi HY. MeCP2, a key contributor to neurological disease, activates and represses transcription. Science. 2008;320:1224–1229. - PMC - PubMed

Publication types