. 2010 Nov 12;143(4):540-51.
doi: 10.1016/j.cell.2010.10.004.

Pausing of RNA polymerase II disrupts DNA-specified nucleosome organization to enable precise gene regulation

Affiliations

Pausing of RNA polymerase II disrupts DNA-specified nucleosome organization to enable precise gene regulation

Daniel A Gilchrist et al. Cell. .

Abstract

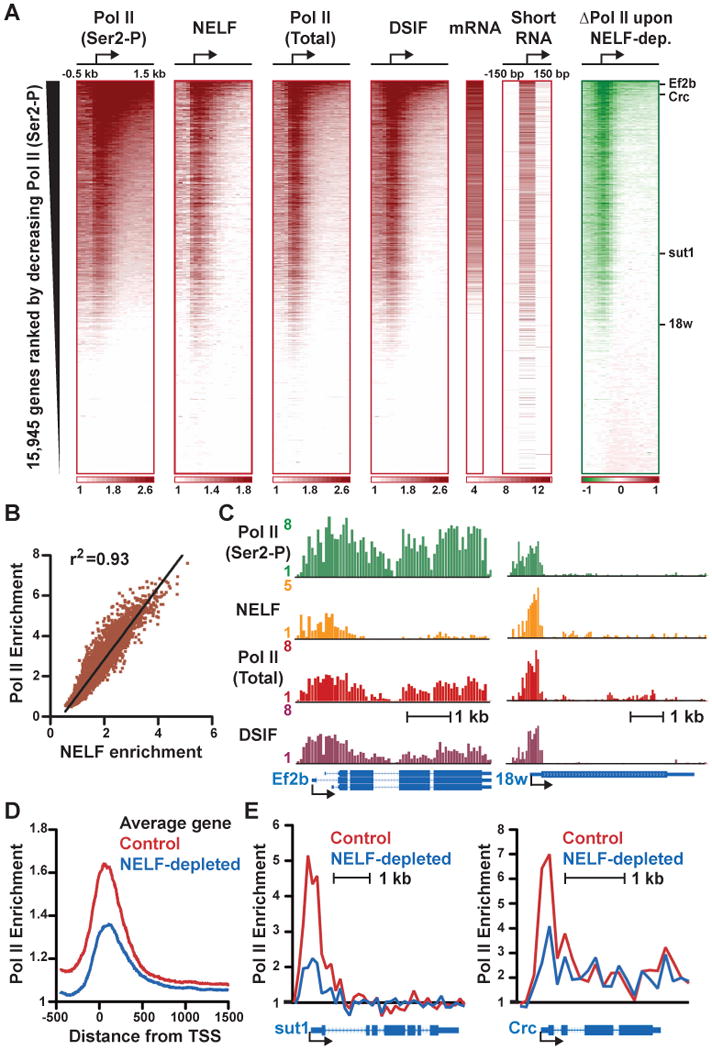
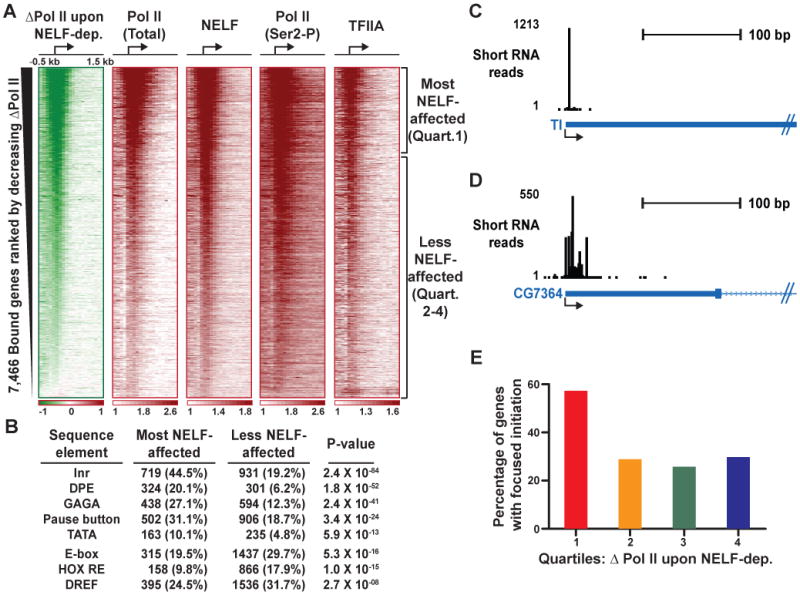
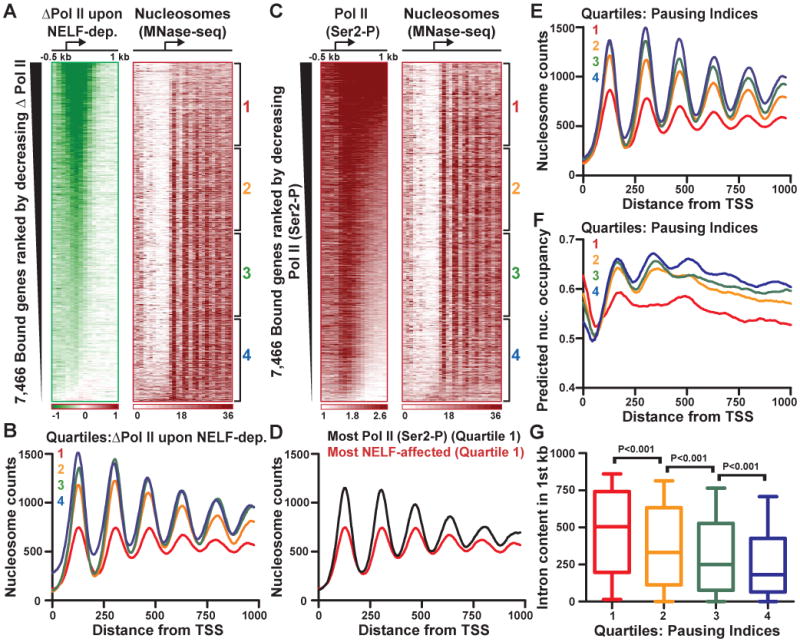
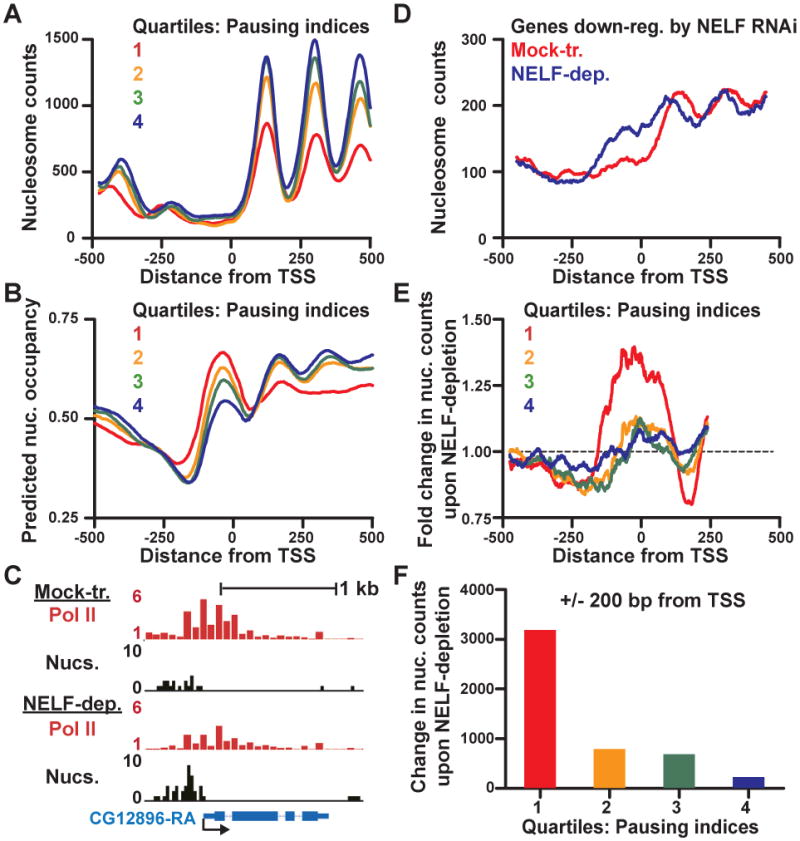
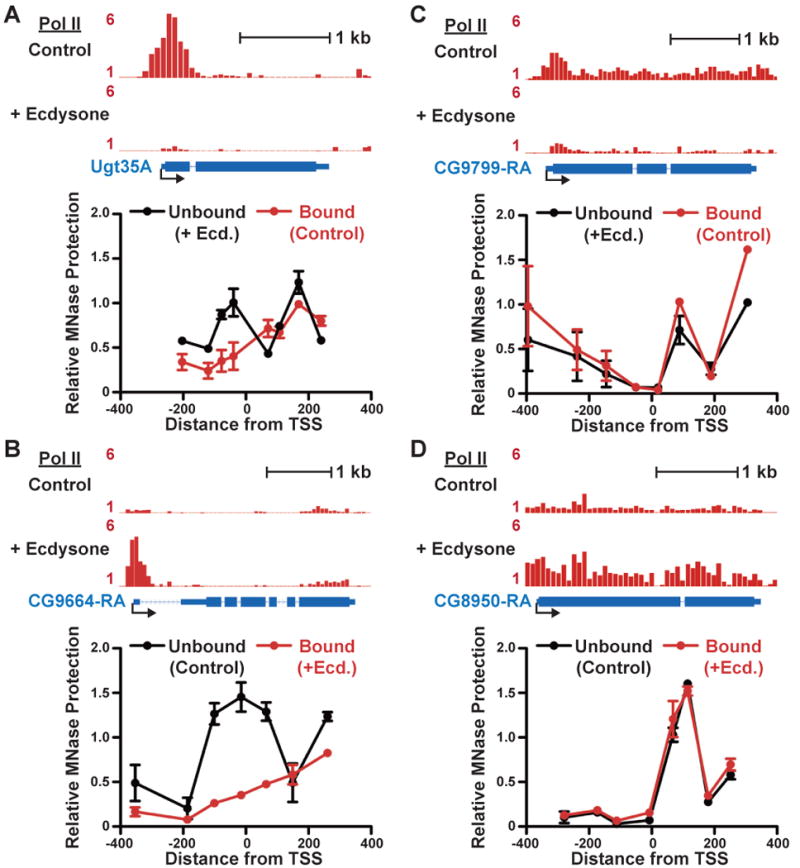
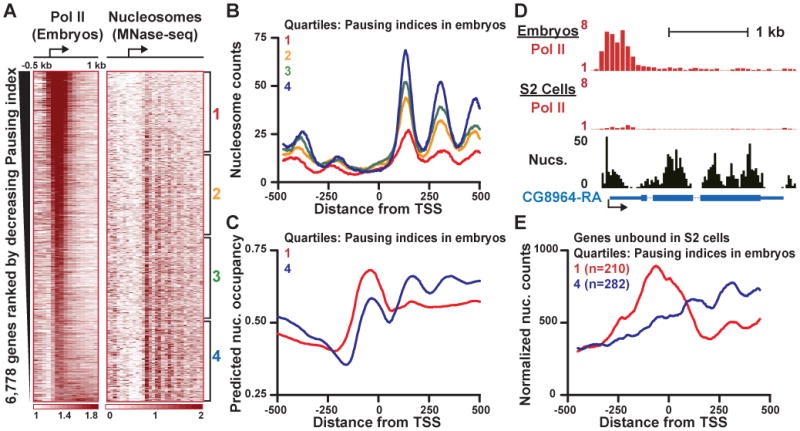
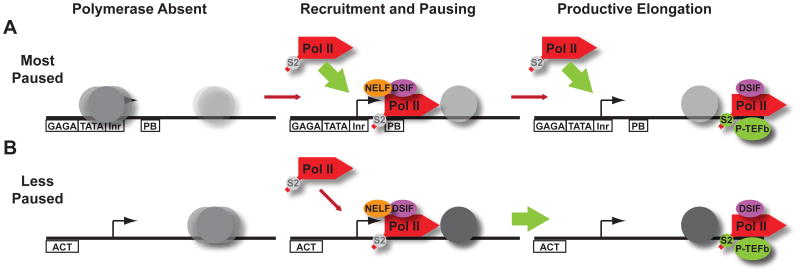
Metazoan transcription is controlled through either coordinated recruitment of transcription machinery to the gene promoter or regulated pausing of RNA polymerase II (Pol II) in early elongation. We report that a striking difference between genes that use these distinct regulatory strategies lies in the "default" chromatin architecture specified by their DNA sequences. Pol II pausing is prominent at highly regulated genes whose sequences inherently disfavor nucleosome formation within the gene but favor occlusion of the promoter by nucleosomes. In contrast, housekeeping genes that lack pronounced Pol II pausing show higher nucleosome occupancy downstream, but their promoters are deprived of nucleosomes regardless of polymerase binding. Our results indicate that a key role of paused Pol II is to compete with nucleosomes for occupancy of highly regulated promoters, thereby preventing the formation of repressive chromatin architecture to facilitate further or future gene activation.


Figures

Figure 1
Figure 1. Pol II, NELF and DSIF Globally Co-localize Near Promoters
(A) Average fold enrichment over genomic DNA from ChIP-chip experiments is shown in 100 bp windows surrounding Drosophila TSSs (shown as arrows) for: actively elongating Pol II (Ser2-P), NELF (α-NELF-B), total Pol II (α-Rpb3) and DSIF (α-Spt5), with color bars at bottom indicating range. Expression levels determined by microarray (mRNA), and short RNAs derived from paused Pol II (Nechaev et al., 2010), are shown in Log2 units. The change in Pol II signal following NELF RNAi is shown at right, as compared to control samples. Range is depicted in color bar, where red signifies gain and green indicates loss in signal. (B) The average enrichment for total Pol II and NELF around promoters (+/- 250 bp) are strongly correlated. (C) ChIP-chip data for indicated factors displayed as fold enrichment at Ef2b (CG2238) a gene with considerable elongating Pol II (left) and 18w (CG8896) a gene with little evidence of productive elongation (right). Gene models below depict exons as boxes and introns as lines. (D) Composite Pol II distribution profiles surrounding all promoters in control and NELF-depleted cells reveal a general decrease in promoter occupancy upon NELF RNAi. (E) NELF-depletion affects Pol II promoter occupancy at genes with very little Pol II enrichment within the gene (sut1, CG8714), and with polymerase signal throughout the transcription unit (Crc, CG9429). See also Figure S1.
Figure 2
Figure 2. Genes with Prominent NELF-mediated Pausing Have Strong Promoters and More Focused Transcription Initiation
(A) Heatmaps depict loss of Pol II signal upon NELF-depletion or fold enrichment for the factors indicated at genes bound by Pol II in untreated cells. The rank order places promoter regions (+/- 250 bp) that lose the most Pol II signal upon NELF depletion at the top, and those least affected at bottom. (B) Promoter motifs are enriched among the most NELF-affected genes (Quartile 1), whereas less NELF-affected genes (Quartiles 2-4) are more likely to possess activator binding sites, such as the E-box, homeo domain response element (Hox RE) or DNA-replication-related element binding factor (DREF). Pol II-bound genes with high confidence TSS annotation were analyzed (n=6,461; including 1,615 of the most- and 4,846 of the less NELF-affected genes), and the number and percentage of genes that possess each motif are shown, along with P-value (Fisher's exact test). (C and D) Examples of genes that display highly focused transcription initiation (Tl, CG5490) or more dispersed initiation patterns (CG7364). Shown are the number of short RNA 5′-ends, at single-nucleotide resolution, that map near each TSS. (E) The most NELF-affected genes (Quartile 1) have more focused initiation than genes less affected by NELF RNAi (Quartiles 2-4). Initiation was considered focused when ≥50% of total promoter-proximal reads (+/- 50 bp from TSS) mapped to a single location. See also Figures S2 and S3.
Figure 3
Figure 3. Nucleosomes are Depleted Downstream of Promoters with Highly Paused Pol II
(A) The most NELF-affected genes are preferentially depleted of downstream nucleosomes. Heatmaps show the change in Pol II signal upon NELF depletion for Pol II-bound genes (as in Figure 1A) and nucleosome occupancy determined by paired-end MNase-seq (color intensity indicates the number of read centers that lie in each 50 bp bin). (B) Pol II-bound genes were divided into quartiles based on the effect of NELF-depletion on Pol II promoter occupancy, from most affected (Quartile 1) to least (Quartile 4). Nucleosome distribution at genes in each quartile was determined by summing the number of nucleosome centers mapping to each position from the TSS to +1 kb. (C) Transcription elongation modestly disrupts chromatin architecture. Heatmaps show Ser2-P Pol II signal and nucleosome distribution at genes rank ordered by levels of Ser2-P enrichment within the gene. (D) Nucleosome occupancy is lower downstream of the most NELF-affected genes than at genes with the most active elongation (panel C, Quartile 1). (E) Nucleosome occupancy at genes separated into quartiles by Pausing indices, where Quartile 1 represents genes with the most pausing. (F) Predicted nucleosome occupancy at genes in each quartile of Pausing indices, based on intrinsic DNA sequence preferences of nucleosome formation (Kaplan et al., 2009). (G) Intron content is shown for genes in each quartile of Pausing indices, revealing significantly elevated intron levels at genes that are highly affected by NELF-depletion (Kruskal-Wallis test, boxes depict 25-75th percentiles, whiskers show 10-90th). See also Figure S4.
Figure 4
Figure 4. DNA Sequences at Paused Genes Favor High Promoter Nucleosome Occupancy
(A) Nucleosome occupancy at Pol II-bound genes (n=7,466) separated into quartiles by Pausing indices, where Quartile 1 represents the most paused genes. Nucleosome occupancy at genes in each quartile was determined by summing the number of nucleosome centers mapping to each position. (B) Predicted nucleosome occupancy at genes in each quartile of Pausing indices, based on intrinsic DNA sequence preferences of nucleosome formation, as in (Kaplan et al., 2009). (C) Loss of Pol II upon NELF-depletion is accompanied by increased nucleosome occupancy. Pol II ChIP-chip fold enrichment (red) and MNase-seq read distribution (black, depicts read centers in 25-bp bins) around a highly NELF-affected gene (CG12896) in mock-treated and NELF-depleted samples. (D) Genes down-regulated by NELF-depletion show increased promoter nucleosome occupancy. Nucleosome occupancy (calculated as in A) at genes whose expression decreased >2-fold following NELF-depletion. (E and F) NELF-depletion leads to increased nucleosome occupancy over highly paused promoters. The change in nucleosome counts upon NELF-depletion (MNase-seq reads in NELF-depleted/Mock-treated samples) is shown for genes in each quartile of Pausing indices as: fold change in read number at each position (E) or the raw increase in the number of nucleosome reads +/- 200 bp from the TSS (F).
Figure 5
Figure 5. The Relationship Between Pol II and Nucleosome Occupancy at Highly Paused and Less Paused Genes
Pol II distribution in S2 cells +/- 24-hour treatment with ecdysone is depicted as fold enrichment from ChIP-chip experiments. MNase protection assays are shown below to compare nucleosome occupancy at each gene in the Pol II-bound vs. unbound state. Data points represent average qPCR signal of DNA protected against MNase digestion from two biological replicates at primer pairs centered at the indicated distance from the TSS; error bars depict range. (A) Ugt35A (CG6644), a gene with a high Pausing index in control cells that becomes unbound by Pol II following treatment with ecdysone. (B) CG9664, a gene unbound by Pol II in control cells that becomes highly paused in ecdysone-treated cells. (C) Ecdysone causes CG9799, a gene with a low Pausing index in control cells, to become unbound by Pol II. (D) CG8950, an unbound gene in control cells, has uniform Pol II distribution upon ecdysone treatment. See also Figure S5.
Figure 6
Figure 6. Promoters Adopt their Predicted Nucleosome Configuration in the Absence of Paused Pol II
(A) Pol II distribution and nucleosome occupancy (H2A.Z nucleosomes from Mavrich et al., 2008) in Drosophila embryos. Genes are rank ordered by descending Pausing indices in embryos. (B) The most highly paused genes in embryos are depleted of downstream nucleosomes. Pol II-bound genes in embryos were divided into quartiles based on Pausing indices and composite metagene analyses of nucleosome reads around their promoters were generated from the data in (Mavrich et al., 2008). (C) Predicted nucleosome occupancy at genes in each quartile of Pausing indices as determined in Drosophila embryos. (D) A promoter with a high Pausing index in embryos (top panel) that is not occupied by Pol II in S2 cells (middle panel) becomes occluded by nucleosomes in the unbound state. Bottom panel shows nucleosome occupancy at the unbound gene in S2 cells as determined by MNase-seq, with read centers displayed in 25 bp bins. (E) In the absence of Pol II, in vivo nucleosome occupancy closely resembles predictions. Nucleosome occupancies were determined in S2 cells, where these genes are not bound by Pol II. Shown are genes that are highly paused (Quartile 1) or lacking paused Pol II (Quartile 4) in embryos. See also Figure S6.
Figure 7
Figure 7. Different Default Chromatin Architectures Specify Distinct Gene Regulatory Strategies
(A) The most paused promoters are inherently occluded by nucleosomes (shown as gray ovals, where color intensity denotes occupancy levels) prior to Pol II binding. Regulated chromatin remodeling (red arrow) can expose strong promoter motifs (shown as boxes below DNA) that allow for efficient Pol II recruitment (green arrow). Subsequent recruitment of P-TEFb and pause release are also regulated at these genes (second red arrow), providing an additional opportunity for gene regulation. (B) Less paused genes display weaker, nucleosome-deprived promoter regions. Polymerase recruitment is rate-limiting at these genes (red arrow), and perhaps more dependent on activators (ACT, binding site shown as box). Pol II is bound by DSIF and NELF at these genes, but pausing is transient and the polymerase moves efficiently into the gene (green arrow).

Comment in

  • The meaning of pausing.
    Espinosa JM. Espinosa JM. Mol Cell. 2010 Nov 24;40(4):507-8. doi: 10.1016/j.molcel.2010.11.025. Mol Cell. 2010. PMID: 21095581

References

    1. Albert I, Mavrich TN, Tomsho LP, Qi J, Zanton SJ, Schuster SC, Pugh BF. Translational and rotational settings of H2A.Z nucleosomes across the Saccharomyces cerevisiae genome. Nature. 2007;446:572–576. - PubMed
    1. Basehoar AD, Zanton SJ, Pugh BF. Identification and distinct regulation of yeast TATA box-containing genes. Cell. 2004;116:699–709. - PubMed
    1. Boettiger AN, Levine M. Synchronous and stochastic patterns of gene activation in the Drosophila embryo. Science (New York, NY. 2009;325:471–473. - PMC - PubMed
    1. Cairns BR. The logic of chromatin architecture and remodelling at promoters. Nature. 2009;461:193–198. - PubMed
    1. Cheng B, Price DH. Properties of RNA Polymerase II Elongation Complexes Before and After the P-TEFb-mediated Transition into Productive Elongation. The Journal of biological chemistry. 2007;282:21901–21912. - PubMed

Publication types

Associated data