. 2010 Nov 12;143(4):592-605.
doi: 10.1016/j.cell.2010.10.032.

Germinal center dynamics revealed by multiphoton microscopy with a photoactivatable fluorescent reporter

Affiliations

Germinal center dynamics revealed by multiphoton microscopy with a photoactivatable fluorescent reporter

Gabriel D Victora et al. Cell. .

Abstract

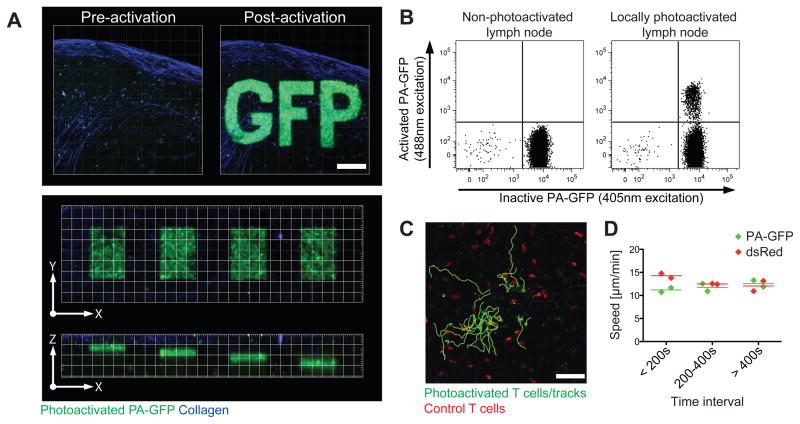
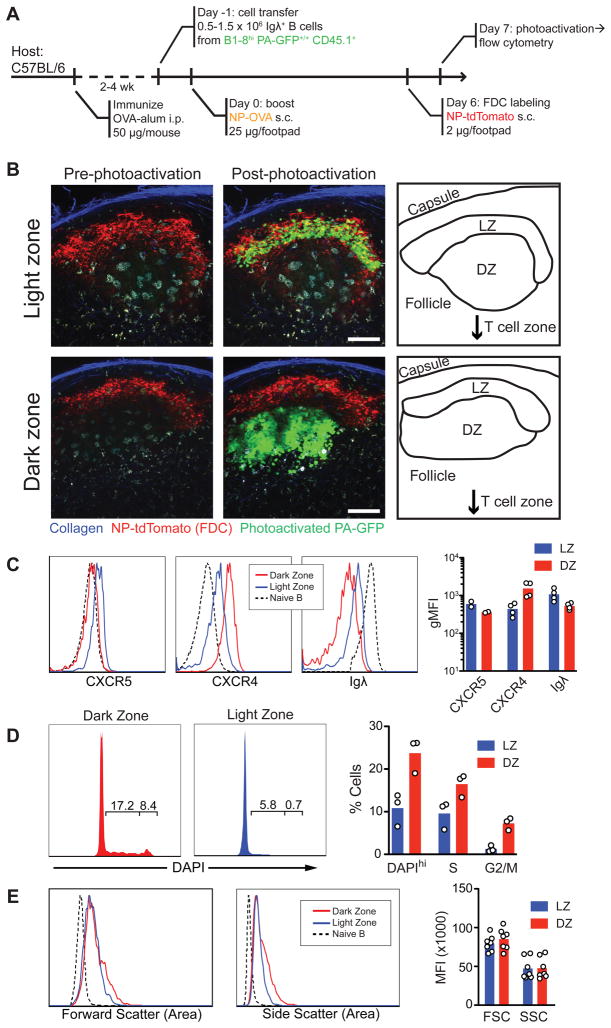
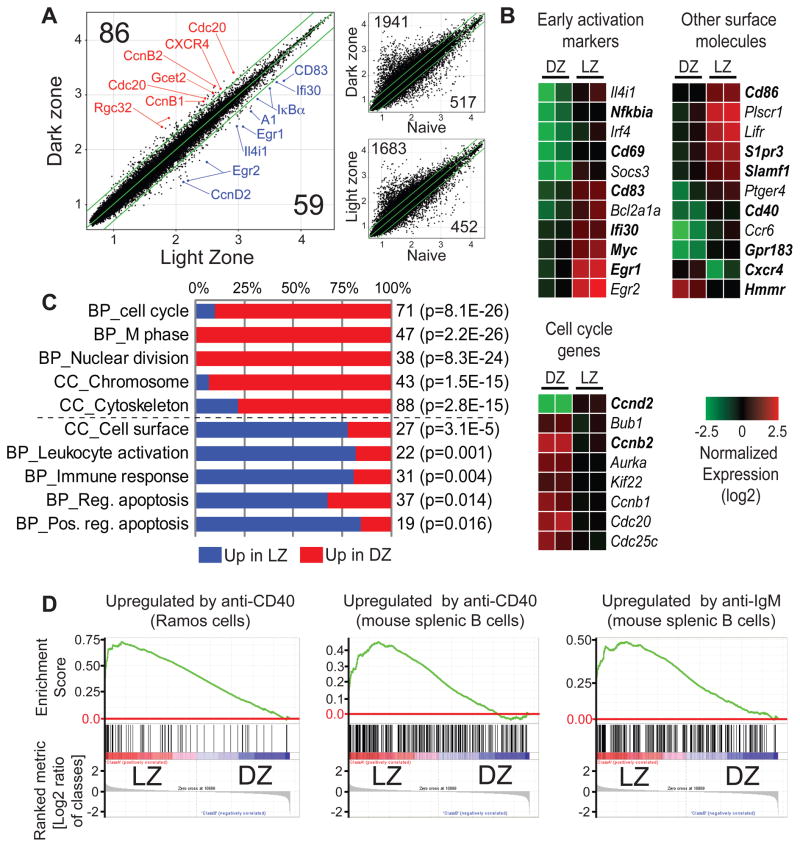
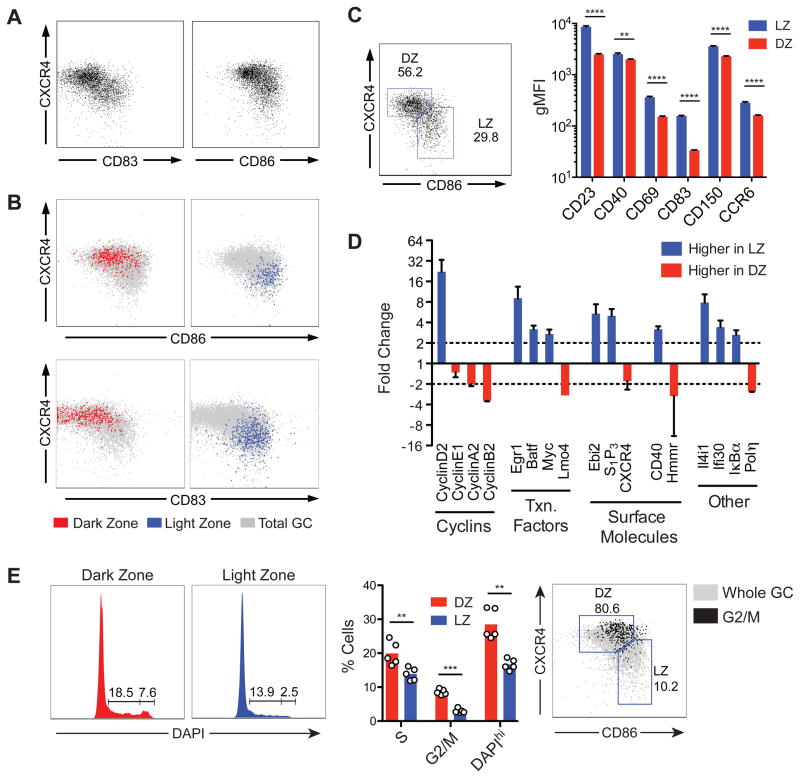
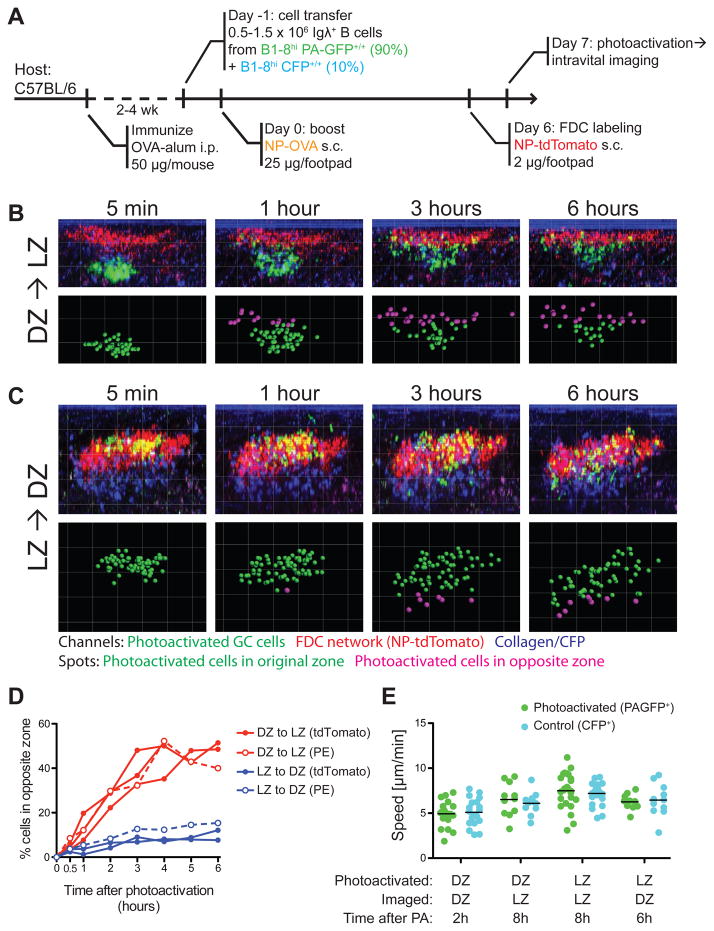
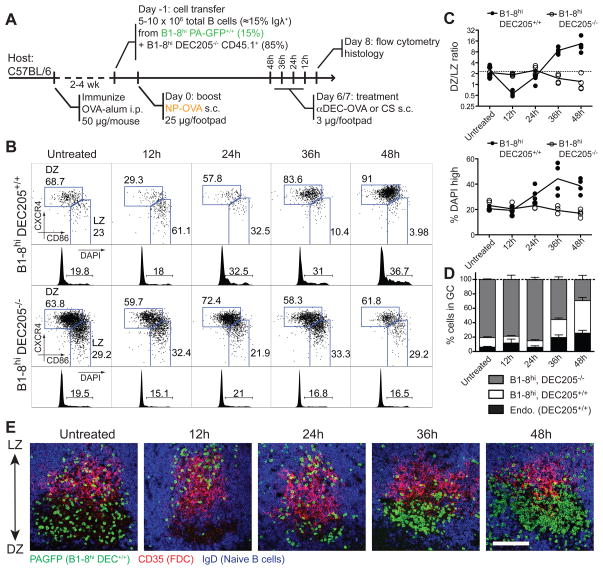
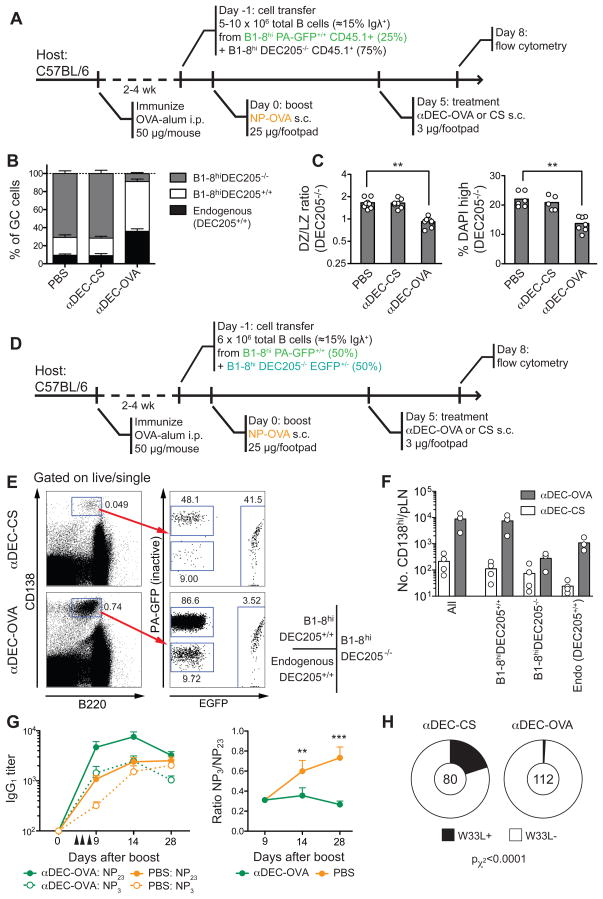
The germinal center (GC) reaction produces high-affinity antibodies by random mutation and selective clonal expansion of B cells with high-affinity receptors. The mechanism by which B cells are selected remains unclear, as does the role of the two anatomically defined areas of the GC, light zone (LZ) and dark zone (DZ). We combined a transgenic photoactivatable fluorescent protein tracer with multiphoton laser-scanning microscopy and flow cytometry to examine anatomically defined LZ and DZ B cells and GC selection. We find that B cell division is restricted to the DZ, with a net vector of B cell movement from the DZ to the LZ. The decision to return to the DZ and undergo clonal expansion is controlled by T helper cells in the GC LZ, which discern between LZ B cells based on the amount of antigen captured and presented. Thus, T cell help, and not direct competition for antigen, is the limiting factor in GC selection.


Figures

Figure 1
Figure 1. Microanatomical labeling of PA-GFP transgenic B cells
(A) Spatial precision of multiphoton photoactivation of explanted inguinal lymph nodes from PA-GFP transgenic mice. Top: precision in the X–Y-axis. Collapsed Z-stacks (60 μm, 5 μm steps). Scale bar = 100 μm. Imaged at λ=940 nm before and after photoactivation at λ=830 nm of a defined region of interest (“GFP”). Bottom: precision in the Z-axis. X–Y and X–Z views of single planes photoactivated at different Z positions 10 μm apart, from 30 to 60 μm below the LN capsule. Grid = 20 × 20 μm. (B) Detection of photoactivated cells by flow cytometry. Non-photoactivated (left) and locally photoactivated inguinal lymph nodes from a PA-GFP transgenic mouse were processed in parallel and analyzed for fluorescence under 407 nm (inactive PA-GFP) and 488 nm (activated PA-GFP) excitation (emission filter = 530/30 nm for both). Photoactivation as described for (A). (C–D) Cells photoactivated in vivo remain viable. Tracks (C) of transferred T cells photoactivated in vivo. (D) Mean velocity of photoactivated and control cells at different time intervals after photoactivation. All photoactivated cells plus an equal number of randomly selected control cells (dsRed transgenic) outside the photoactivation area were tracked. Each symbol represents one independent experiment (1 movie per experiment, ~20 cells of each type per movie.).
Figure 2
Figure 2. Phenotype of LZ and DZ cells
(A) Diagrammatic representation of the experimental protocol. (B) Examples of LZ (top row) and DZ (bottom row) multiphoton photoactivation. Collapsed Z-stacks (40 μm, 5 μm steps). Scale bar = 50 μm. Imaged at λ=940 nm before and after photoactivation at λ=830 nm. (C–E) Chemokine receptor and BCR expression, DNA content (DAPI), and forward and side scatter in photoactivated LZ or DZ cells. GC cells gated as live/single, CD45.1+, FAShi. Non-GC cells (shown for comparison) gated as Igλ+FAS Left panels: quantification of flow cytometry data. Each symbol represents one experiment (pools of 3–5 mice per experiment).
Figure 3
Figure 3. Gene expression in LZ and DZ cells
(A) Differences in gene expression between cells photoactivated in LZ and DZ. Samples generated as indicated in Fig. 2A and sorted as live/single, CD45.1+, FAShi/GL-7+, activated PAGFP+. Large panel, scatter plots showing raw expression levels (log10) for ~45,000 microarray probes in LZ and DZ. Selected genes are indicated in red (up in DZ) or blue (up in LZ). Smaller panels, differences in gene expression between LZ or DZ and naive B cells, shown for comparison. Green lines indicate 2-fold boundary. Numbers in black indicate the number of genes upregulated by more than 2-fold in the corresponding zone in both replicate assays. (B) Heatmaps showing normalized expression (log2) of selected genes whose expression differed by more than 2-fold between LZ and DZ in both replicate assays. The full list of genes in this category can be found in Table S1. Genes in bold type were confirmed by either flow cytometry or qPCR. (C) Gene Ontology (GO) analysis (biological process [BP] and cellular compartment [CC]) of an expanded list of genes differing by at least 1.33-fold between LZ and DZ (see Extended Experimental Procedures and Table S1). Blue and red bars represent the fraction of genes in a given GO category upregulated in LZ and DZ respectively. The total number of genes is indicated to the right of the bar, as is the p-value (Benjamini correction) for enrichment in the zone with the larger fraction of the genes over the whole mouse genome. An expanded GO analysis is presented in Table S2. (D) GSEA analysis showing enrichment of gene signatures of CD40 and BCR ligation (gene sets obtained from the literature) in LZ cells. All nominal p-values and FDR rates < 0.001. An expanded GSEA analysis is presented in Table S3. All data are the average of two experiments, each corresponding to a pool of 15–20 lymph nodes per condition.
Figure 4
Figure 4. Distinguishing LZ and DZ cells by flow cytometry
(A) Examples of distribution of GC cells according to expression of CXCR4 and CD83 or CD86 in day 7 secondary GCs generated as shown in Fig. 2A. Gated on B220+CD45.1+CD38FAS+. (B) Distribution of GC cells photoactivated in LZ or DZ according to expression of CXCR4 and CD86 or CD83. Gated on CD45.1+, FAShi, photoactivated PA-GFP+. (C) Expression of surface markers in LZ and DZ gates by flow cytometry. Polyclonal GCs were generated in wild-type B6 mice as indicated in Fig. S3A, and LZ and DZ populations were defined by expression of CD86 and CXCR4, as shown in the left panel. Right panel, expression of surface markers in LZ and DZ gates. Histograms are presented in Fig. S3B. Representative of 2–3 independent experiments with 2–3 mice each. Error bars represent SEM. (D) Confirmation of microarray results by qPCR. LZ and DZ cells sorted according to expression of CD86 and CXCR4. GCs generated as in Fig. S3A. Sorting strategy and post-sort purity are shown in Fig. S3C. Graph represents data from two experiments with pools of 10 mice each. Error bars represent SEM. (E) Cell cycle analysis by DNA content of LZ and DZ cells gated according to expression of CD86 and CXCR4. Left panel, DAPI profiles of cells in LZ and DZ gates. Middle panel, quantification of data from two independent experiments; each symbol represents one mouse. Right panel, cells in G2/M concentrate in the DZ gate. Percentages refer to G2/M cells. ** p < 0.01; *** p < 0.001; **** p < 0.0001, paired T test. Bars = standard error of mean.
Figure 5
Figure 5. Interzonal migration in GCs
(A) Diagrammatic representation of the experimental protocol. (B) Time series showing position of individual cells photoactivated in the DZ, at different times after photoactivation. Top row, side (X–Z) view of whole germinal centers within popliteal LNs of live mice. The LZ is labeled with NP-tdTomato (red); for better visualization, the PA-GFP signal shown (green) was isolated from autofluorescence and CFP bleed-through by co-localization filtering. Bottom row, spots were placed on photoactivated cells. Green spots indicate cells in the photoactivated zone, whereas magenta spots represent cells that have crossed over to the opposite (non-photoactivated) zone. (C) Time series for cells photoactivated in LZ. Details as in (B). (D) Quantification of seven independent experiments (three LZ to DZ and four DZ to LZ, one of which was terminated at 4 h). Closed symbols: LZ labeled by NP-tdTomato. Open symbols, LZ labeled by PE ICs. (E) Speed of photoactivated GC cells and control CFP cells at different times after photoactivation. Each symbol represents one track; each column represents one cell type in one movie; bars represent the mean. Differences between PAGFP+ and CFP+ cells in the same movie were not significant (p>0.5) by Mann-Whitney U test. Different movies were acquired using different settings, and therefore should not be compared to each other.
Figure 6
Figure 6. T cell help availability limits interzonal migration
(A) Diagrammatic representation of the experimental protocol. (B) LZ/DZ distribution and DNA content (DAPI) analysis of DEC205+/+ (top) and DEC205−/− (bottom) of popliteal lymph node GC B cells at different times after injection of αDEC-OVA. (C) Quantification of (B). Each symbol represents one mouse. (D) Fraction of GC cells derived from transferred DEC205+/+ and DEC205−/− B1-8hi and endogenous (DEC205+/+) cells in popliteal lymph nodes of mice treated with αDEC-OVA for different lengths of time. Bar = standard error of mean. (E) Histology showing the distribution of DEC205+/+ cells in popliteal lymph node germinal centers at different times after injection of αDEC-OVA. DEC205+/+ cells, which express PA-GFP (used here as a genetic label), were stained with anti-GFP antibodies (green). LZ and DZ can be identified by presence of CD35hi follicular dendritic cells (FDCs, in red) and absence of IgD+ B cells (in blue), respectively. All data representative of two experiments.
Figure 7
Figure 7. T cell help limits germinal center selection and affinity maturation
(A) Diagrammatic representation of the experimental protocol for panels B–D. PA-GFP is used as a genetic label in its non-activated form. (B) Fraction of GC cells derived from transferred DEC205+/+ and DEC205−/− B1-8hi and endogenous (DEC205+/+) cells in popliteal lymph nodes 72 hours after treatment with αDEC-OVA or αDEC-CS. (C) DZ/LZ ratio and % cells in S/G2/M phase (DAPI high) among DEC205+/+ and DEC205−/− popliteal lymph node GC B cells 72 hours after injection of αDEC-OVA or control αDEC-CS. ** p < 0.01, Kruskall-Wallis test, Dunn’s post test. (D) Diagrammatic representation of the experimental protocol for panels E and F. PA-GFP is used as a genetic label in its non-activated form. (E) Plots show plasmablast/plasma cell gate (CD138hiB220int) and fraction of cells of each genotype, 72 hours after treatment with αDEC-OVA or αDEC-CS. (F) Absolute number of CD138hi/B220int of each genotype per popliteal LN. (A–F) Each symbol represents one mouse; data pooled from 2–3 experiments. (G) Titers of total (NP23) and high-affinity (NP3) NP-reactive IgG1 (left) and total/high-affinity ratio (right) in NP-OVA-immunized wild-type mice treated or not with αDEC-OVA. Arrowheads indicate doses of treatment (details as in Fig. S6B). Pooled data from two experiments, five mice per group per experiment. Error bars represent SEM. ** p < 0.01, *** p < 0.001, Mann-Whitney U Test. (H) Proportion of V186.2 clones bearing the high-affinity W33L mutation in day-14 wild-type germinal centers from mice treated with either αDEC-OVA or αDEC-CS (details as in Fig. S6C). The number of clones analyzed is indicated in the center of each chart. Pooled data from two experiments, three mice per experiment.

Comment in

References

    1. Allen CD, Ansel KM, Low C, Lesley R, Tamamura H, Fujii N, Cyster JG. Germinal center dark and light zone organization is mediated by CXCR4 and CXCR5. Nat Immunol. 2004;5:943–952. - PubMed
    1. Allen CD, Okada T, Cyster JG. Germinal-center organization and cellular dynamics. Immunity. 2007a;27:190–202. - PMC - PubMed
    1. Allen CD, Okada T, Tang HL, Cyster JG. Imaging of germinal center selection events during affinity maturation. Science. 2007b;315:528–531. - PubMed
    1. Allen D, Simon T, Sablitzky F, Rajewsky K, Cumano A. Antibody engineering for the analysis of affinity maturation of an anti-hapten response. EMBO J. 1988;7:1995–2001. - PMC - PubMed
    1. Basso K, Klein U, Niu H, Stolovitzky GA, Tu Y, Califano A, Cattoretti G, Dalla-Favera R. Tracking CD40 signaling during germinal center development. Blood. 2004;104:4088–4096. - PubMed

Publication types

Associated data