. 2010 Dec 7;20(23):2067-77.
doi: 10.1016/j.cub.2010.10.021. Epub 2010 Nov 11.

Developmental control of late replication and S phase length

Affiliations

Developmental control of late replication and S phase length

Antony W Shermoen et al. Curr Biol. .

Abstract

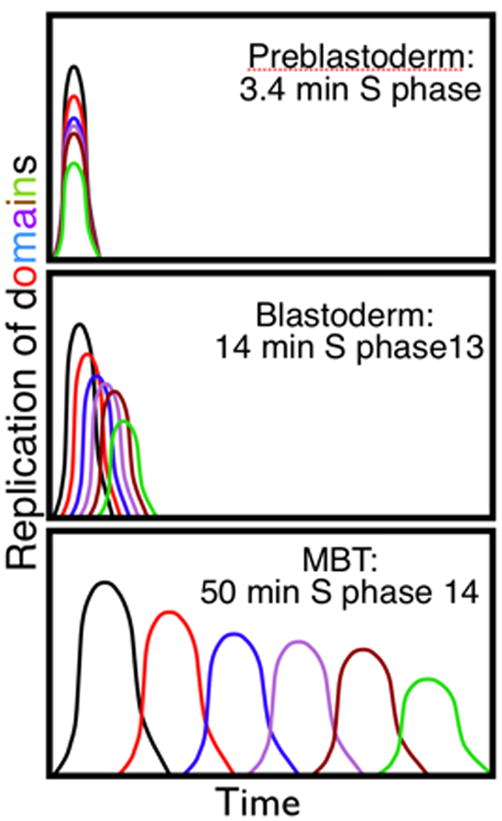
Background: Fast, early embryonic cell cycles have correspondingly fast S phases. In early Drosophila embryos, forks starting from closely spaced origins replicate the whole genome in 3.4 min, ten times faster than in embryonic cycle 14 and a hundred times faster than in a wing disc. It is not known how S phase duration is regulated. Here we examined prolongation of embryonic S phases, its coupling to development, and its relationship to the appearance of heterochromatin.

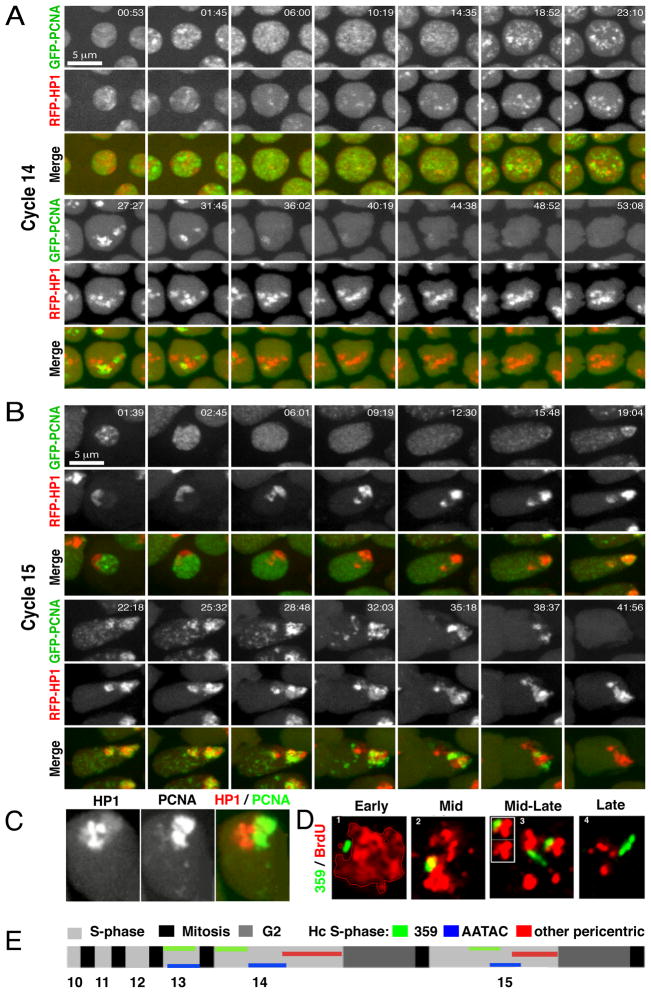
Results: Imaging of fluorescent nucleotide incorporation and GFP-PCNA gave exquisite time resolution of S phase events. In the early S phases, satellite sequences replicated rapidly despite a compact chromatin structure. In S phases 11-13, a delay in satellite replication emerged in sync with modest and progressive prolongation of S phase. In S phase 14, major and distinct delays ordered the replication of satellites into a sequence that occupied much of S phase. This onset of late replication required transcription. Satellites only accumulated abundant heterochromatin protein 1 (HP1) after replicating in S phase 14. By cycle 15, satellites clustered in a compact HP1-positive mass, but replication occurred at decondensed foci at the surface of this mass.

Conclusions: The slowing of S phase is an active process, not a titration of maternal replication machinery. Most sequences continue to replicate rapidly in successive cycles, but increasing delays in the replication of satellite sequences extend S phase. Although called constitutively heterochromatic, satellites acquire the distinctive features of heterochromatin, compaction, late replication, HP1 binding, and aggregation at the chromocenter, in successive steps coordinated with developmental progress.


Figures

Figure 1
Figure 1. Contributions to S phase Length
(A) A time line illustrating cell cycle timing between cycles 10 and 15 in Drosophila embryos (at 25 °C). The early cycles lack gap phases. Mitosis duration is relatively constant at about 5 to 5.5 min. S phase is very short in the early cycles and gradually extends during the blastoderm cycles. Cycle 14 is marked by the dramatic events of the MBT (see text) and an abrupt change in cell cycle characteristics; S phase is greatly increased in duration and the first G2 appears. The timing of mitosis 14 and cycle 15 events are approximations, because the different cells of the embryo begin to follow distinct schedules at mitosis 14. (B) Early S phases replicate the genome quickly with a conventional fork speed by using many origins that fire synchronously. The figure illustrates this as numerous similarly sized replication bubbles distributed uniformly in three different regions of the genome (replication units) indicated in blue, black and red. Two factors contribute importantly to prolongation of S phase, increased spacing of origins or a reduction in the synchrony in the time at which different replication units replicate. Here we test the contributions of these two factors to the initial slowing of S phase during early Drosophila embryogenesis. (C) The distribution of nucleotide incorporation changes from widespread to focal during early S phase 14. Embryos were pulse labeled with Alexa-dUTP for about 2 min, fixed and staged. A stack of images taken at planes through the nuclei were deconvolved to produce a 3D data set and the figure shows a projection created by summing the individual image plans to show incorporation throughout the nucleus. Incorporation in the 2 min prior to 5 min is widely distributed with a few small areas lacking label, while incorporation just prior to 15 min is largely restricted to foci.
Figure 2
Figure 2. DNA Incorporation in Syncytial Cycles and in Cycle 14
(A) Last replicating sequences become more restricted with progress from cycle 11 to 13. The time line shows that Alexa546-dUTP, when injected late in S phase, will be incorporated briefly and appear in anaphase chromosomes a few min later. To label the last replicating sequences, we fixed embryos within 8 min (at ~21 °C) of injection, selected anaphase embryos, and recorded the distribution of Alexa-dUTP (red) on the anaphase chromosomes (blue/Hoechst in cycle 12 and 13). Dotted lines encircle anaphase pairs. In cycle 11, incorporation marks the complete anaphase complement, while in cycle 12, label is more restricted and in cycle 13 the late incorporated label is almost entire restricted to pericentric regions. (B) Regions replicated at different stages of cycle 14. The diagram outlines the schedule used to label sequences replicated at different stages of S phase14. The panels below show incorporated Alexa-dUTP (red) displayed along anaphase chromosomes visualized by staining for phospho-histone H3 (green). During the first ten min of S phase 14, labeling is widespread, albeit uneven. Subsequently, label incorporation is localized, gradually decreasing in intensity and becoming more restricted. Note the faint labeling of chromosome ends at 25 min (left panel) and abundant late incorporation localizing to leading (pericentric) regions of the anaphase chromosomes.
Figure 3
Figure 3. Injection of PCNA-GFP Demonstrates the Changing Character of the Syncytial Divisions
Frames from real time records (Movies 1–3) of syncytial embryos injected with PCNA-GFP show progression of S phase in the last three syncytial cycles prior to the MBT. The age of the nuclei (measured from telophase) is shown within each frame (minutes and seconds). While each nucleus begins S phase with fine dispersed speckles of PCNA localization, within each cycle there is an increase in the accumulation of larger bright foci at the apical periphery of each nucleus. The duration, brightness and number of these bright foci increase progressively in cycles 11, 12 and 13. Note that the early stages of interphase 12 and 13, which show essentially uniform nuclear GFP-PCNA, are not included.
Figure 4
Figure 4. Chromatin Compaction and HP1 Accumulation in the Blastoderm Embryo
(A) Satellite sequences are compacted in early embryos as shown by staining with Hoechst 33258 (blue in merge), and FISH (green) to the 359 repeat on the X-chromosome (see also Figure S1–S3). (B) Shows frames from 5ovie 4 tracking the localization of injected recombinant GFP-HP1. HP1 is nuclear and a progressive recruitment to foci is evident in successive blastoderm cycles. While these foci are small and faint compared to those that appear later, they are concentrated in the apical periphery of the nuclei where the centromeres cluster (Figure S4).
Figure 5
Figure 5. Satellite Sequences Shift to Late Replication According to Individual Schedules
Co-localization of Alexa546-dUTP (red) introduced in a short pulse (1–2 min) and an in situ signal for the 359 or AATAC satellite (green) reveals the time of replication of these regions. (A) Shows the incorporation in nuclei of cycle 13 embryos, at different stages during S phase 13. Replication of 359 (left image of each pair) starts earlier than AATAC labeling (right image), and AATAC labeling continues after bulk labeling declines. (B) Timing of 359 replication in cycle 14. The age of cycle 14 embryos was assessed by degree of cellularization and nuclear shape (Figure S7). Nuclei from different times during cycle 14 show about a 2-min delay in 359 replication compared to general labeling. Note partial resolution of two subdomains of of a 359 focus in the 2–4 min image, and the selective labeling of one of the two subdomains. Replication of 359 is completed at 18 min. See Figure S7 for staging. (C) Timing of AATAC replication in cycle 14. The dUTP in incorporated between about 18 min and 28 min. (D) Summarizes the replication timing of the two satellites in cycle 14. G2 is an arbitrary length since there is considerable variation in its length between mitotic domains. Note that replication of the 359 locus precedes abundant HP1 recruitment to this locus in cycle 14 (Figure S5), and that other satellites also have distinctive replication schedules (Figure S6).
Figure 6
Figure 6. Real-time Data for Replication and Heterochromatin Protein Binding
Embryos where injected with GFP- PCNA (green in merge) and RFP-HP1 (red in merge) proteins before cycle 10 and allowed to mature to cycle 14 or 15 prior to time-lapse imaging. Selected frames from movies (supplement Movie 5 and Movie 6 for A and B respectively) are shown as separate grey level images for greater detail and then a row of color merge images. The time stamp is min:sec after telophase, and, since there is no G1 in these cycles, it represents time in S phase. (A) S phase 14 progress. The GFP-PCNA signal is initially intense with dispersed speckles seen throughout the nucleus. At about 18 minutes of S14, the PCNA signal becomes more mottled with larger intense foci that are localized apically. The intensity of dispersed speckling declines and the foci grow larger, then decline in number, and decrease in intensity, becoming undetectable about 50 min into cycle 14. The initial HP1 signal shows weak foci. After about 18 min, new foci appear and intensify (particularly between 23:10 and 27:27). Early in S phase PCNA overlaps the weak HP1 foci quiet, but later, when the bright foci appear, PCNA and HP1 foci are adjacent and non-overlapping (e.g. 27:27 frame). (B) S phase 15 progress. Although mitotic chromosomes are depleted of HP1 throughout most of mitosis, an apical mass of HP1 forms at the close of mitosis and is evident immediately upon formation of the interphase nucleus. Note the distinction in the distribution of HP1 between early cycle 14 and early cycle 15. The apical HP1 focus brightens during S phase 15 without obvious expansion. Initially, PCNA exhibits bright speckles that are distributed throughout the nuclear volume except in the region of the HP1 staining mass. By about 15 min the general PCNA distribution has become somewhat more coarsely speckled and a halo of PCNA surrounds the HP1 mass. As S phase progresses, the HP1 staining mass is broken into subdomains and these are associated but not overlapping with bright GFP-PCNA. (C) Unfolding of compacted HP1 foci during late replication. The bright foci of PCNA overlie fainter regions of HP1 that lie adjacent to the bright foci of HP1 (also evident in frames from ~28 min to 38 min of B). (D) Timing of replication of 359 in cycle 15. BrdU labeled (red) embryos were fixed and probed for 359 sequences (green). Replication of 359, indicated by coincidence of labels, occurred in mid S phase after the completion of bulk DNA replication. (E) Time line summarizing the replication schedule as derived from Figures 2, 5 and 6.
Figure 7
Figure 7. Transcription is required for the onset of late replication at the MBT
α–amanitin was injected into one pole of embryos during cycle 13. After 30 minutes, Alexa546-dUTP was injected in order to monitor S phase. The chimeric embryo shown below the diagram depicts two changes in the embryo: The left-hand panels depict that there has been an extra syncytial division in the injected end of the embryo, indicating acceleration of cycle 14, and a syncytial-like S phase 15. The right hand panels depict a normal cycle 14 with late replication. Both 359 and AATAC overlap in their time of replication in the injected end, but the color of intense in situ signal dominates in this image (overlap with Alexa546-dUTP is shown in Figure S8). Movie 7 shows the consequence of α–amanitin in real-time.
Figure 8
Figure 8. The Changing Character of Replication in Embryonic S phases
This figure summarizes the concepts derived from the data, but the curves depicted are not a direct representation of data. In early (preblastoderm) embryos, satellite sequences (represented by different colors) replicate in synch with the rest of the genome (black) so that the genome is replicated in 3.4 min (Blumenthal et al., 1974). Gradual slowing during the syncytial blastoderm divisions (cycles 10–13) is accompanied by small delays in the replication of satellite sequences and slight prolongation of the replication times of individual domains (represented by the broadening of the peaks of replication). By the time of the MBT in cell cycle 14, the timing of replication of the satellite sequences is delayed, a phenomenon often referred as late replication. However, the term late replication encompasses a variety of different schedules of replication. Replication of each domain incurs a different delay, but, once initiated, it is quickly completed. The time required to replicate a domain increases somewhat during early development (represented by the broadening of the peaks of replication) but, as in this schematic, this adds only about 6 min to S phase length (compare black curves in different cycles), and the increase in S phase length is primarily due to a transition from coincident replication of all of the domains in the early fast cycles to sequential replication in a prolonged S phase.

Comment in

References

    1. LIMA-DE-FARIA A. Differential uptake of tritiated thymidine into hetero- and euchromatin in Melanoplus and Secale. J Biophys Biochem Cytol. 1959;6:457–466. - PMC - PubMed
    1. LYON MF. Sex chromatin and gene action in the mammalian X-chromosome. Am J Hum Genet. 1962;14:135–148. - PMC - PubMed
    1. Brown SW. Heterochromatin. Science. 1966;151:417–425. - PubMed
    1. Lucchesi JC, Kelly WG, Panning B. Chromatin remodeling in dosage compensation. Annu Rev Genet. 2005;39:615–651. - PubMed
    1. Dalle Nogare DE, Pauerstein PT, Lane ME. G2 acquisition by transcription-independent mechanism at the zebrafish midblastula transition. Dev Biol. 2009;326:131–142. - PubMed

Publication types

MeSH terms

Substances