Review
. 2011 Jan;50(1):1-13.
doi: 10.1016/j.plipres.2010.10.006. Epub 2010 Nov 11.

Group XV phospholipase A₂, a lysosomal phospholipase A₂

Affiliations
Review

Group XV phospholipase A₂, a lysosomal phospholipase A₂

James A Shayman et al. Prog Lipid Res. 2011 Jan.

Abstract

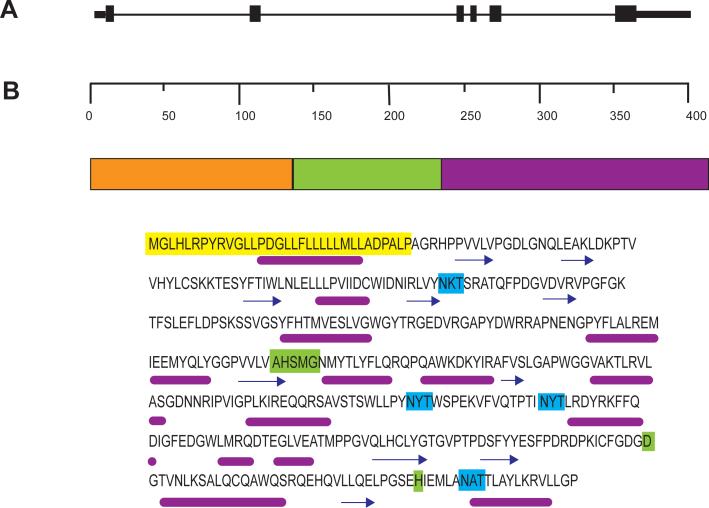
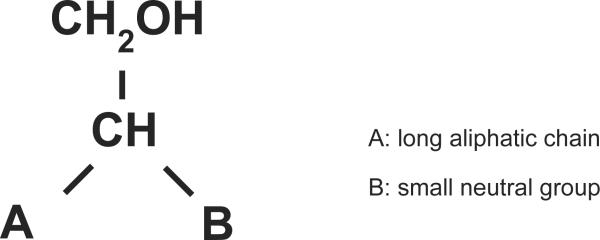
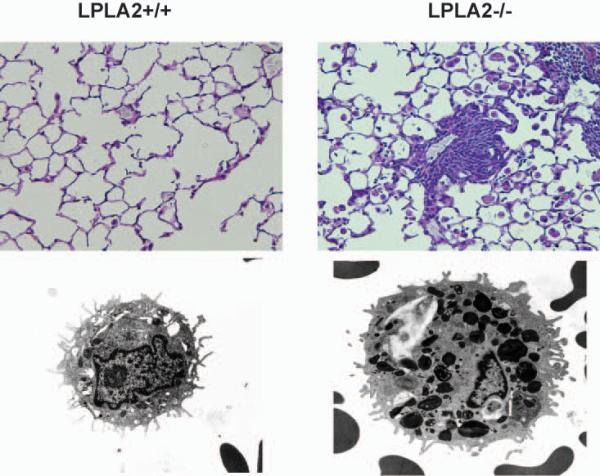
A phospholipase A₂ was identified from MDCK cell homogenates with broad specificity toward glycerophospholipids including phosphatidylcholine, phosphatidylethanolamine, phosphatidylserine, and phosphatidylglycerol. The phospholipase has the unique ability to transacylate short chain ceramides. This phospholipase is calcium-independent, localized to lysosomes, and has an acidic pH optimum. The enzyme was purified from bovine brain and found to be a water-soluble glycoprotein consisting of a single peptide chain with a molecular weight of 45 kDa. The primary structure deduced from the DNA sequences is highly conserved between chordates. The enzyme was named lysosomal phospholipase A₂ (LPLA₂) and subsequently designated group XV phospholipase A₂. LPLA₂ has 49% of amino acid sequence identity to lecithin-cholesterol acyltransferase and is a member of the αβ-hydrolase superfamily. LPLA₂ is highly expressed in alveolar macrophages. A marked accumulation of glycerophospholipids and extensive lamellar inclusion bodies, a hallmark of cellular phospholipidosis, is observed in alveolar macrophages in LPLA₂(-/-) mice. This defect can also be reproduced in macrophages that are exposed to cationic amphiphilic drugs such as amiodarone. In addition, older LPLA₂(-/-) mice develop a phenotype similar to human autoimmune disease. These observations indicate that LPLA₂ may play a primary role in phospholipid homeostasis, drug toxicity, and host defense.


Figures

Fig. 1
Fig. 1. Cleavage sites of glycerophospholipids by phospholipases
R1, R2 and X refer to the fatty acids and the polar group, respectively, of the stereospecifically numbered phospholipids.
Fig. 2
Fig. 2. Enzymatic reactions of LPLA2 with its dual transacylase and phospholipase A2 activities
LPLA2 recognized phosphatidylcholine, phosphatidylethanolamine, phosphatidylglycerol and phosphatidylserine as substrates. The respective lyso-phosphoglycerides are produced regardless of whether N-acetylsphingosine is present. The acyl-LPLA2 intermediate is shown.
Fig. 3
Fig. 3
A. Genomic structure of LPLA2. The gene consists of 6 exons localized to chromosome 16q22.1. B. The protein structure and amino acid sequence of LPLA2. The deduced domains were derived from the Ginzu program starting with PSI-Blast. Domain 2 (residues 133 – 234) is highly homologous with the catalytic domain of lecithin coholesterol acyltransferase and is underlined. Predicted functions for this domain include palmitoyl-protein hydrolase, phospholipase, lipase, sterol esterase, and carboxylesterase activities. No predicted activites can be assigned to the first (residues 1 – 132) and third (residues 235 – 412) domains. The signal peptide is highlighted in yellow. The lipase motif and additional catalytic amino acids are highlighted in green. The glycosylation sites are highlighted in turquoise. Below the amino acid sequent is the PSIPRED predicted structure [105]. Helices are denoted by a magenta line and coil regions are denoted by arrows. C. Minimum-evolution tree of LPLA2 and LCAT proteins. The numbers in parentheses represent NCBI protein GIs for corresponding LPLA2 or LCAT proteins. The protein sequences were first aligned using the Clustal program within the MEGA 4.0 package [106]. Evolutionary distances were computed by using the Tamura-Nei method [107]. Bootstrap analysis using 1,000 repetitions provided support for individual nodes [108]. The numbers next to the branches are the percentages of replicate trees in which the associated taxa clustered together in the bootstrap test (1,000 replicates). The tree is drawn to scale; branch lengths are in the same units as those of the evolutionary distances used to infer the phylogenetic tree. Scale bar indicates nucleotide substitutions per site.
Fig. 3
Fig. 3
A. Genomic structure of LPLA2. The gene consists of 6 exons localized to chromosome 16q22.1. B. The protein structure and amino acid sequence of LPLA2. The deduced domains were derived from the Ginzu program starting with PSI-Blast. Domain 2 (residues 133 – 234) is highly homologous with the catalytic domain of lecithin coholesterol acyltransferase and is underlined. Predicted functions for this domain include palmitoyl-protein hydrolase, phospholipase, lipase, sterol esterase, and carboxylesterase activities. No predicted activites can be assigned to the first (residues 1 – 132) and third (residues 235 – 412) domains. The signal peptide is highlighted in yellow. The lipase motif and additional catalytic amino acids are highlighted in green. The glycosylation sites are highlighted in turquoise. Below the amino acid sequent is the PSIPRED predicted structure [105]. Helices are denoted by a magenta line and coil regions are denoted by arrows. C. Minimum-evolution tree of LPLA2 and LCAT proteins. The numbers in parentheses represent NCBI protein GIs for corresponding LPLA2 or LCAT proteins. The protein sequences were first aligned using the Clustal program within the MEGA 4.0 package [106]. Evolutionary distances were computed by using the Tamura-Nei method [107]. Bootstrap analysis using 1,000 repetitions provided support for individual nodes [108]. The numbers next to the branches are the percentages of replicate trees in which the associated taxa clustered together in the bootstrap test (1,000 replicates). The tree is drawn to scale; branch lengths are in the same units as those of the evolutionary distances used to infer the phylogenetic tree. Scale bar indicates nucleotide substitutions per site.
Fig. 4
Fig. 4. Comparison of the secondary structures of mouse LPLA2 and LCAT
Shown are the sites of the homologous cysteines and the catalytic triads.
Fig. 5
Fig. 5. Common features of acceptor lipophilic alcohols recognized by LPLA2
A denotes a long aliphatic carbon chain. B denotes a small neutral group such as -H, -OH, -OCH3, -OCOCH3 and –NHCOCH3.
Fig. 6
Fig. 6. Light microscopy of lung and transmission electron micrographs of AMs obtained from LPLA2+/+ and LPLA2−/− mice
The PAS stain compares the lungs of 18 month old LPLA2+/+ and LPLA2−/− mice. Shown are increased numbers and size of alveolar macrophages in the knockout mice. The transmission electron micrographs were taken at the same magnification.
Fig. 7
Fig. 7. Effect of increasing cationic amphiphilic drug (CAD) concentration on the interaction of LPLA2 with lipid membrane
PL denotes phospholipid.

Similar articles

Cited by

References

    1. De Duve C, Wattiaux R. Functions of lysosomes. Annu Rev Physiol. 1966;28:435–92. - PubMed
    1. Turk B, Turk V. Lysosomes as “suicide bags” in cell death: myth or reality? J Biol Chem. 2009;284:21783–7. - PMC - PubMed
    1. Schuchman EH. Acid sphingomyelinase, cell membranes and human disease: lessons from Niemann-Pick disease. FEBS Lett. 2010;584:1895–900. - PubMed
    1. Mellors A, Tappel AL. Hydrolysis of phospholipids by a lysosomal enzyme. J Lipid Res. 1967;8:479–85. - PubMed
    1. Fowler S, De Duve C. Digestive activity of lysosomes. 3. The digestion of lipids by extracts of rat liver lysosomes. J Biol Chem. 1969;244:471–81. - PubMed

Publication types

MeSH terms

LinkOut - more resources