. 2011 Jan 15;50(2):281-94.
doi: 10.1016/j.freeradbiomed.2010.11.006. Epub 2010 Nov 11.

Nonesterified cholesterol content of lysosomes modulates susceptibility to oxidant-induced permeabilization

Affiliations

Nonesterified cholesterol content of lysosomes modulates susceptibility to oxidant-induced permeabilization

John J Reiners Jr et al. Free Radic Biol Med. .

Abstract

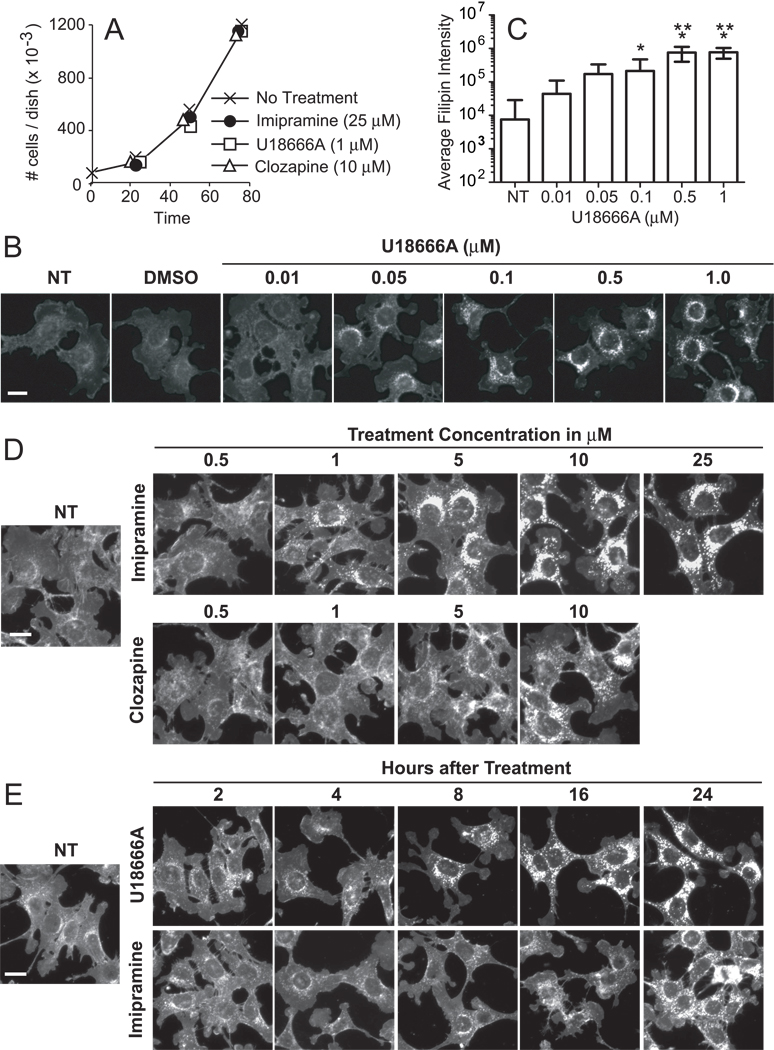
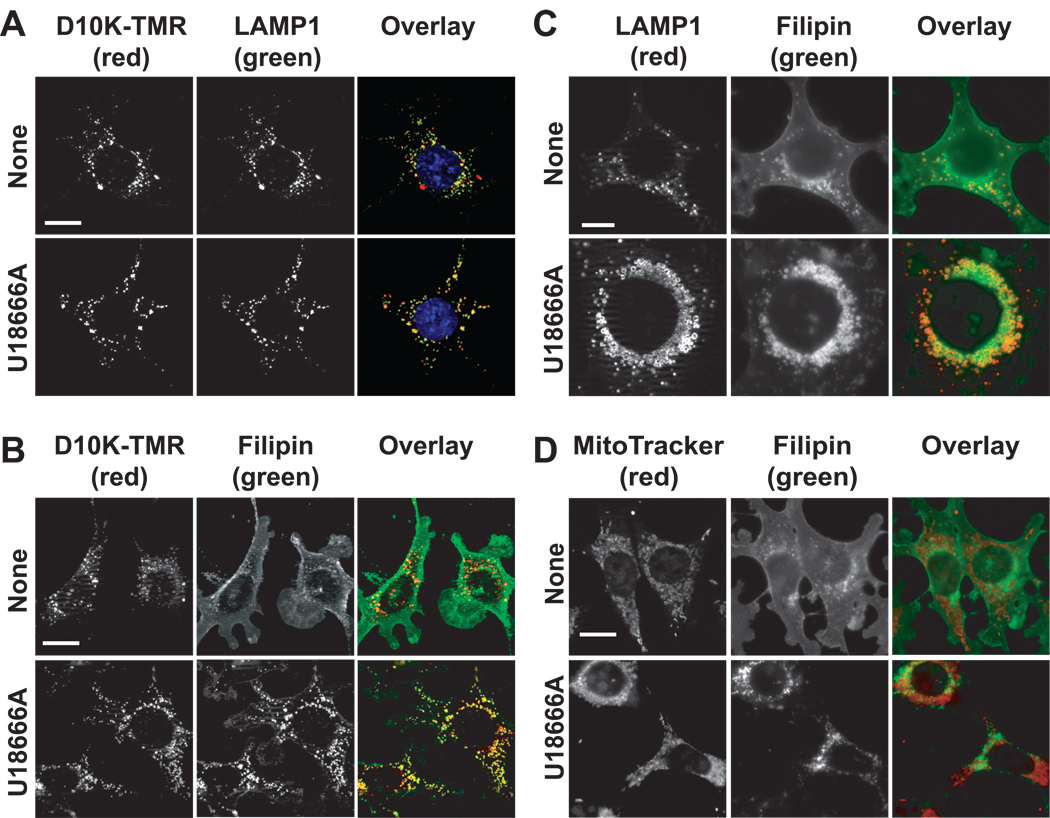
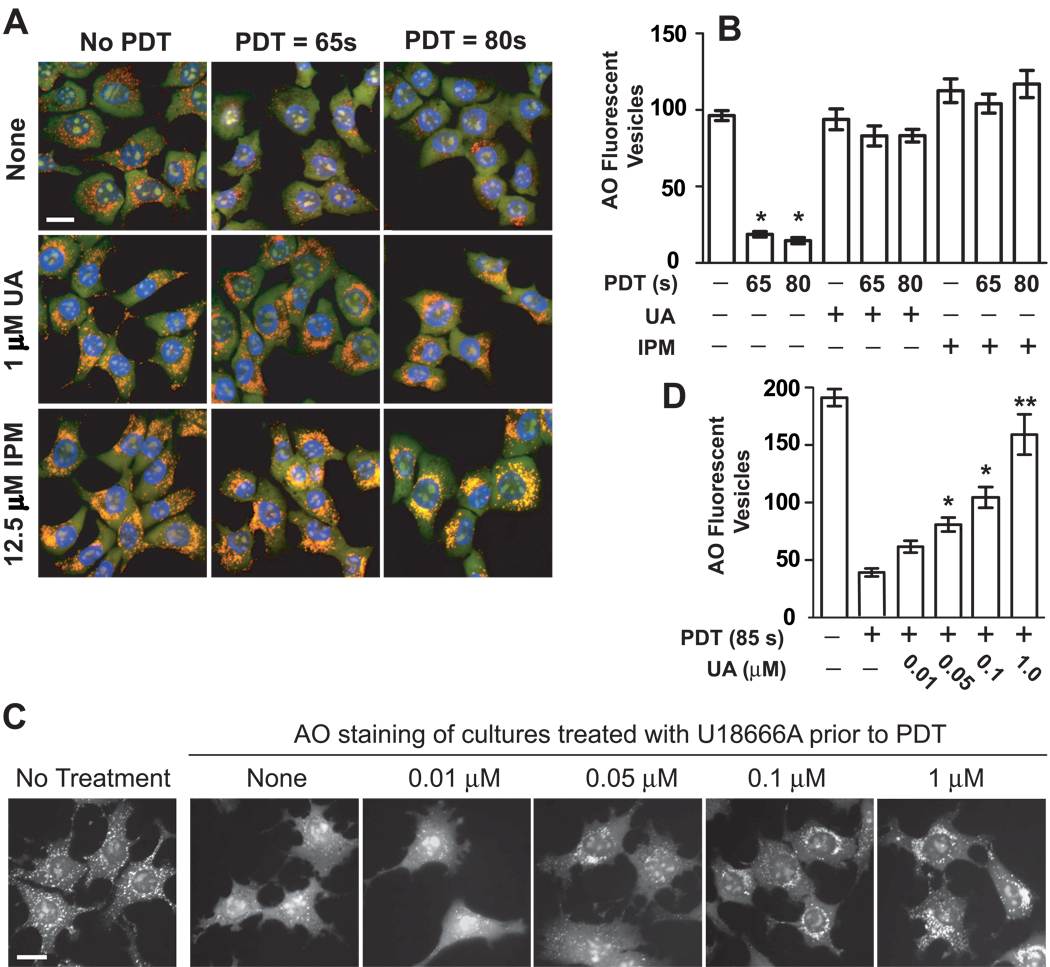
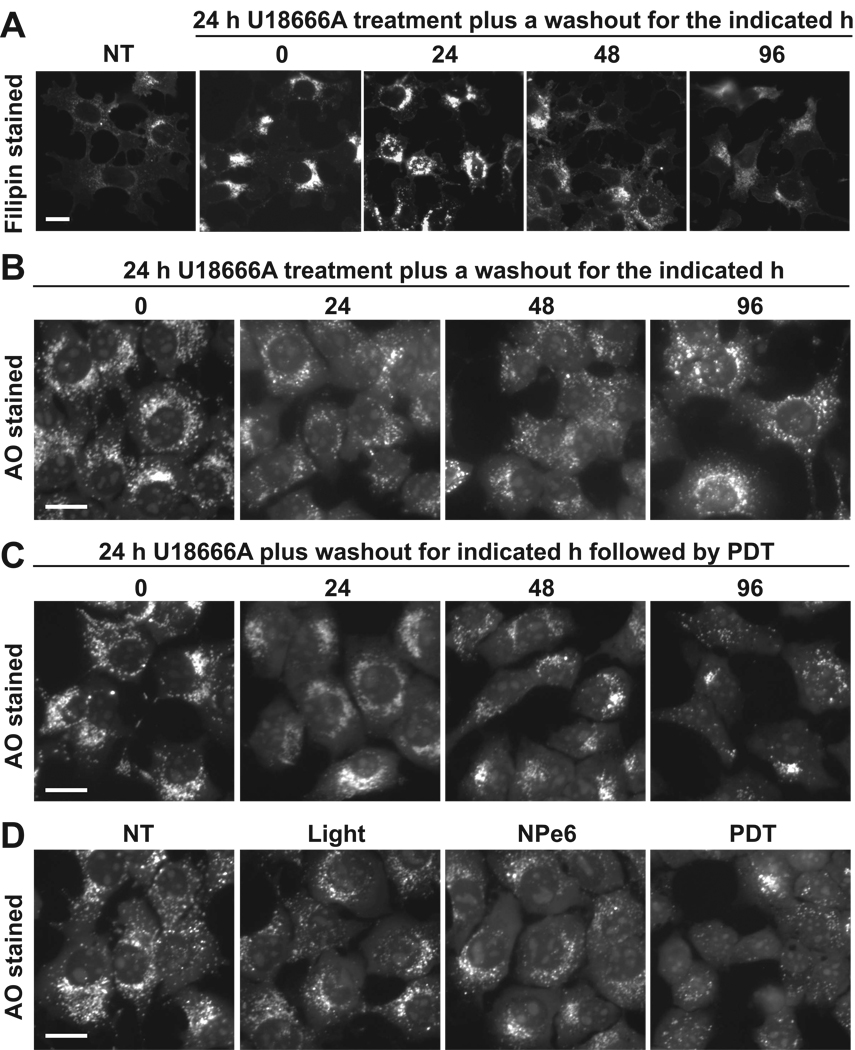
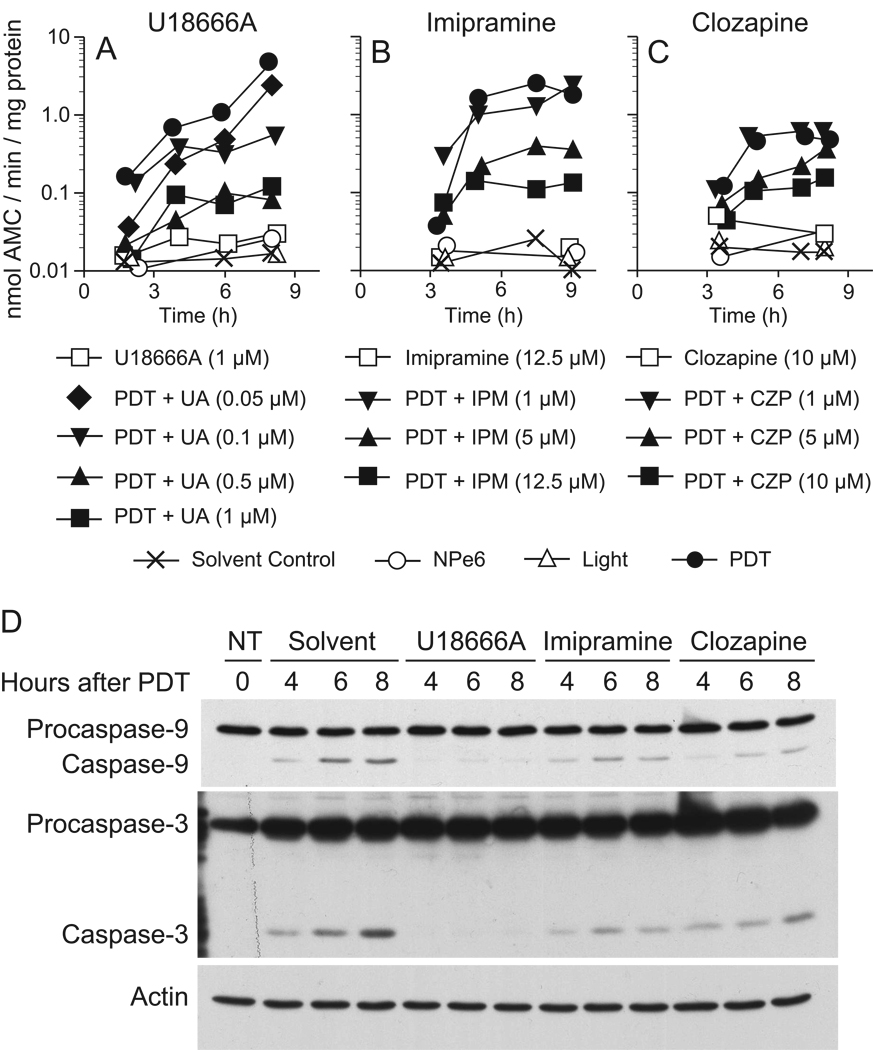
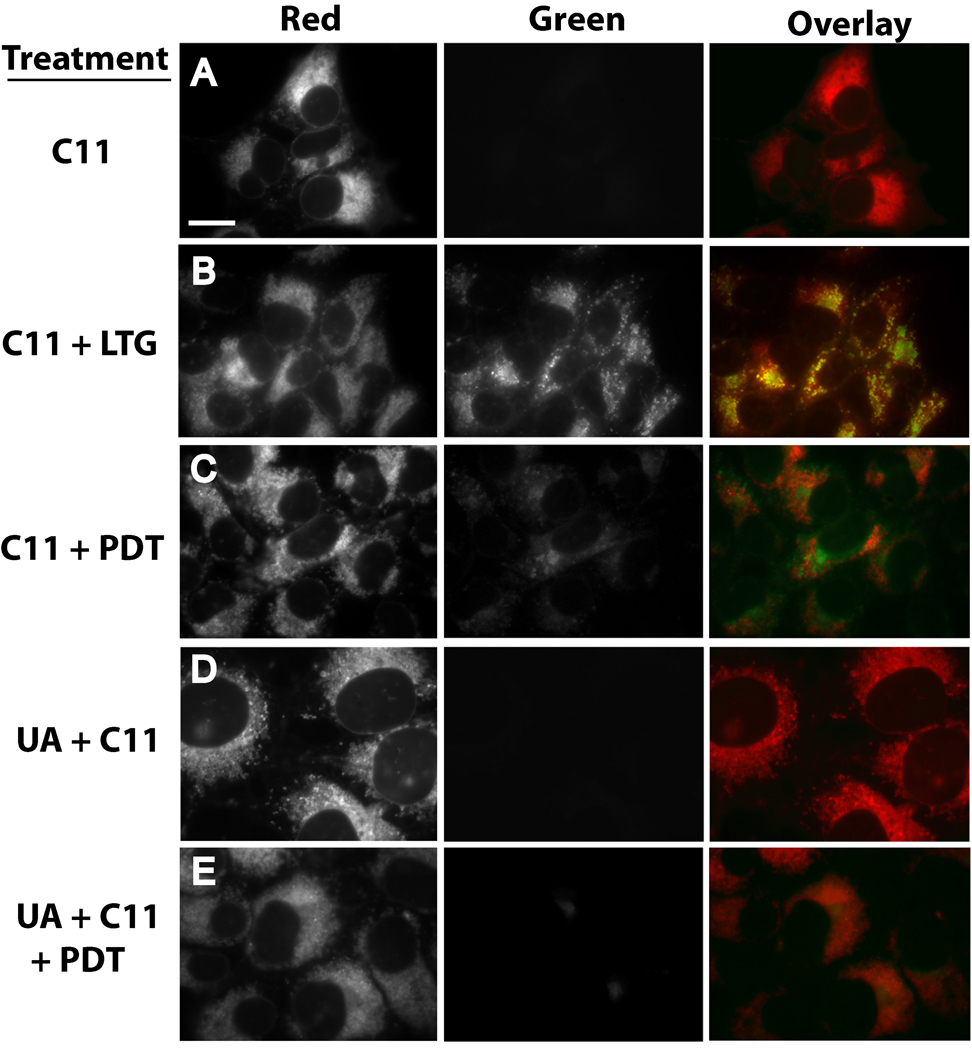
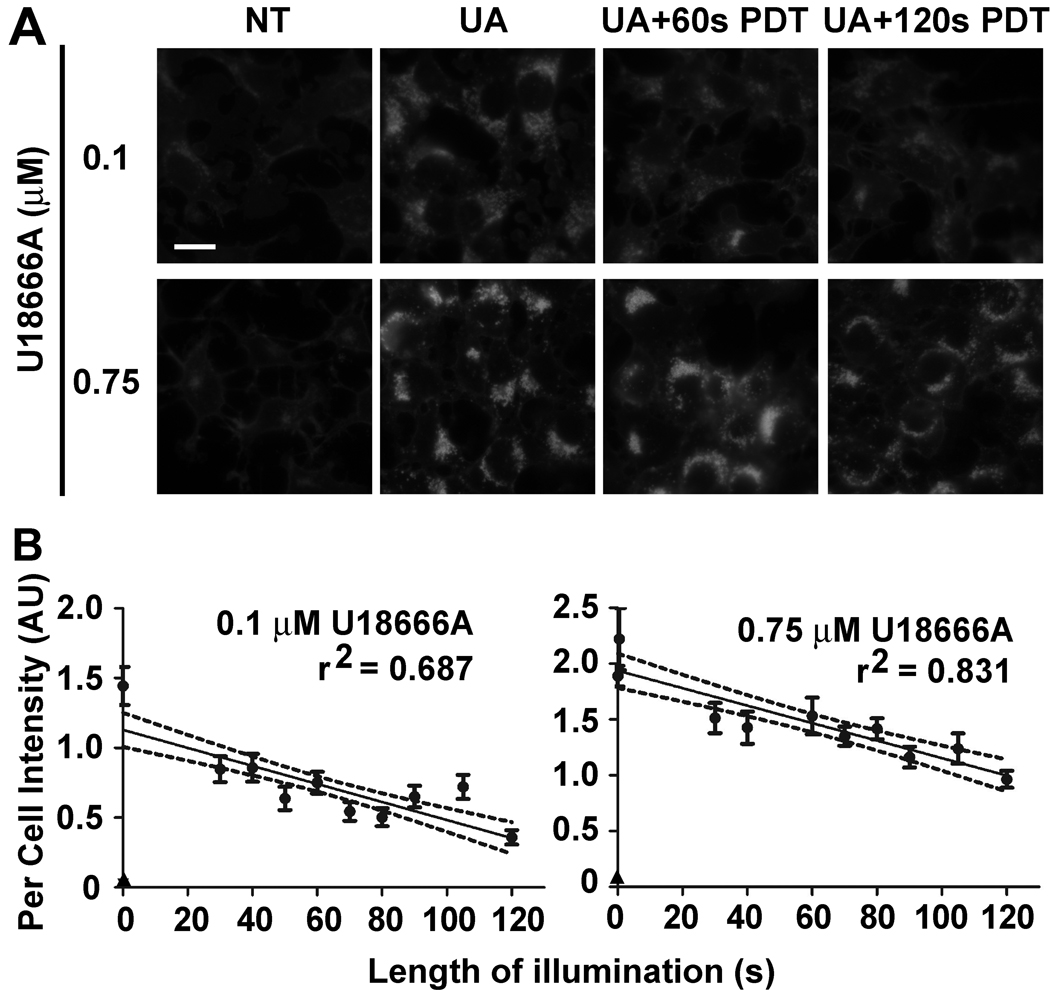
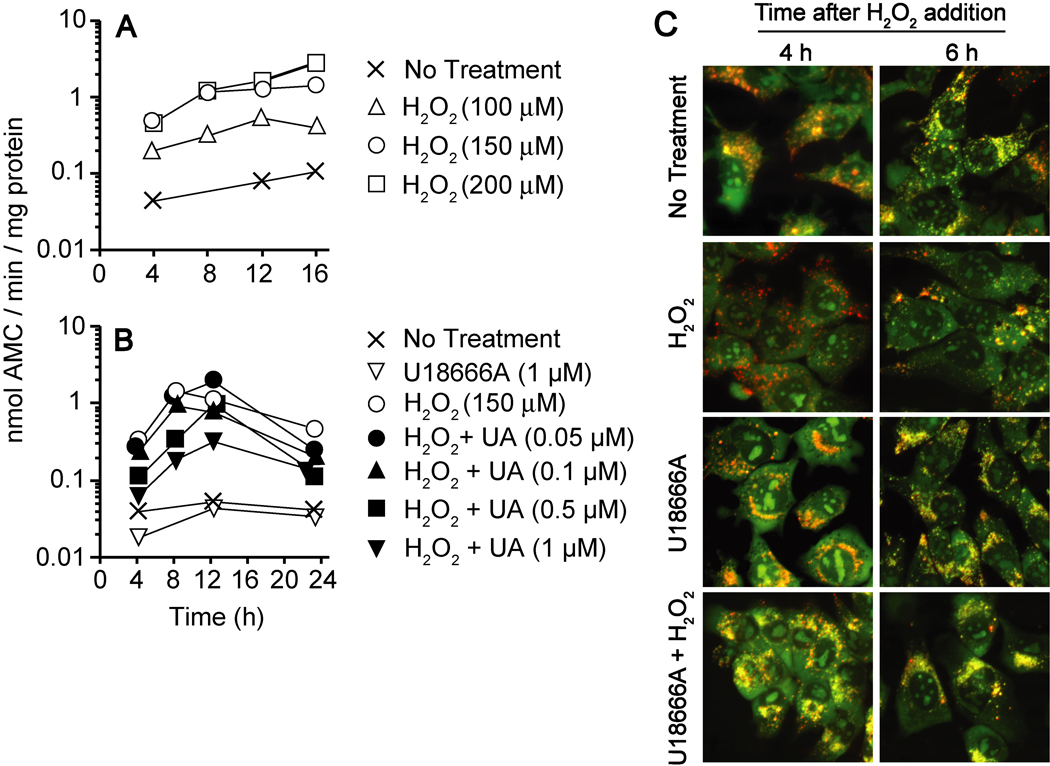
Reactive oxygen species (ROS) can induce lysosomal membrane permeabilization (LMP). Photoirradiation of murine hepatoma 1c1c7 cultures preloaded with the photosensitizer NPe6 generates singlet oxygen within acidic organelles and causes LMP and the activation of procaspases. Treatment with the cationic amphiphilic drugs (CADs) U18666A, imipramine, and clozapine stimulated the accumulation of filipin-stainable nonesterified cholesterol/sterols in late endosomes/lysosomes, but not in mitochondria. Concentration-response studies demonstrated an inverse relationship between lysosomal nonesterified cholesterol/sterol contents and susceptibility to NPe6 photoirradiation-induced intracellular membrane oxidation, LMP, and activation of procaspase-9 and -3. Similarly, the kinetics of restoration of NPe6 photoirradiation-induced LMP paralleled the losses of lysosomal cholesterol that occurred upon replating U18666A-treated cultures in CAD-free medium. Consistent with the oxidation of lysosomal cholesterol, filipin staining in U18666A-treated cultures progressively decreased with increasing photoirradiating light dose. U18666A also suppressed the induction of LMP and procaspase activation by exogenously added hydrogen peroxide. However, neither U18666A nor imipramine suppressed the induction of apoptosis by agents that did not directly induce LMP. These studies indicate that lysosomal nonesterified cholesterol/sterol content modulates susceptibility to ROS-induced LMP and possibly does so by being an alternative target for oxidants and lowering the probability of damage to other lysosomal membrane lipids and/or proteins.


Figures

Figure 1
Figure 1
Effects of U18666A, imipramine and clozapine on 1c1c7 cell growth and filipin staining. (A) Cultures of murine hepatoma 1c1c7 cells were treated with the indicated concentrations of U18666A, imipramine, or clozapine before being harvested and counted. Data represent means ± SD of three plates per treatment per time period. Similar results were obtained in a second independent experiment. (B) 1c1c7 cultures were treated with nothing (NT), DMSO or indicated concentrations of U18666A for ~24 h before being processed for filipin staining. (C) Quantification of per cell filipin fluorescence intensity in 1c1c7 cultures treated with U18666A for ~24 h. Data are from the experiment depicted in panel B and represent means ± SD of analyses of 18–35 cells for each treatment group. *Significantly greater than non-treated (NT) control, P<0.05. **Significantly greater than 0.1 µM U18666A treatment group, P<0.05. (D) 1c1c7 cultures were treated with nothing or indicated concentrations of imipramine or clozapine for ~24 h before being stained with filipin. Similar patterns were observed in two additional experiments. (E) 1c1c7 cultures were treated with nothing or 1 µM U18666A or 25 µM imipramine for different lengths of time before being processed for filipin staining. White bar in panels B–E represents 20 microns.
Figure 2
Figure 2
U18666A-induced endosomal/ysosomal accumulation of non-esterified sterols. (A) 1c1c7 cultures were incubated with dextran-10000 tetramethylrhodamine (D10K-TMR) overnight prior to being washed and refed with fresh medium. At the time of refeeding some cultures were treated with 1 µM U18666A. After an additional 8 h of incubation the cultures were fixed and processed for detection of D10K-TMR (red) and LAMP1 (green). Colocalization of D10K-TMR and LAMP1 is indicated by orange – yellow punctate spots. (B) 1c1c7 cultures were incubated with D10K-TMR overnight prior to being washed, and refed with fresh medium. Some cultures were subsequently treated with 1 µM U18666A and incubated an additional 8 h before being stained with filipin. Colocalization of filipin (green) and D10K-TMR (red) structures is indicated by orange – yellow punctate spots. (C) 1c1c7 cultures were treated with nothing or 1 µM U18666A for 24 h prior to being fixed and processed for filipin (green) and LAMP1 (red) staining. (D) 1c1c7 cultures were treated with nothing or 1 µM U18666A for ~22 h prior to the addition of MitoTracker Green (MTG). After an additional 5 min of incubation cultures were washed, fixed and stained with filipin. The pictures presented in panels A–D are representative of what was observed in multiple fields of cells. White bar in panels A, B and D represents 20 microns. White bar in panel C represents 10 microns.
Figure 3
Figure 3
CAD suppression of LMP. (A) 1c1c7 cultures were treated with nothing, 1 µM U18666A (UA), or 12.5 µM imipramine (IPM) for ~22 h prior to being washed and refed with fresh medium (± 33 µM NPe6 for 1 h) and subsequently photoirradiated for either 65 or 80 s. Sixty min after medium change the cultures were incubated with AO and HO33342 for ~10 min prior to being viewed by fluorescence microscopy. Treatment conditions are noted in the figure. The pictures presented in panel A are representative of what was observed in multiple fields of cells derived from 4 independent experiments. (B) Quantification of per cell AO-stained acidic vesicles observed in the experiment depicted in panel A. Data represent means ± SD of analyses of 10–12 cells per treatment group. *Significantly less than non-treated and all U18666A and imipramine treatment groups, P<0.05. (C) 1c1c7 cultures were pretreated for ~24 h with different concentrations of U18666A, or nothing, prior to being incubated with 33 µM NPe6 for 1 h, and then refed and photoirradiated. Cultures were stained with AO ~1 h after photoirradiation, and imaged 10 min later. A parallel group received no treatment prior to AO staining. Similar results were observed in a second independent experiment. (D) Quantification of per cell AO-stained acidic vesicles observed in the experiment depicted in panel C. Data represent means ± SD of 15–20 cells per treatment group. *Significantly greater than PDT control, P<0.05. **Signficantly greater than all treatment groups except non-treated control, P<0.05. White bar in panels A and C represents 20 microns.
Figure 4
Figure 4
Time-dependent recovery of sensitivity to PDT-induced LMP following washout of U18666A. (A) 1c1c7 cultures were treated with nothing (NT) or 1 µM U18666A for 24 h prior to being washed and refed with new medium lacking U18666A. Cultures were stained with filipin immediately prior to washout or 24, 48 and 96 h post medium change. (B) 1c1c7 cultures were treated with 1 µM U18666A for 24 h prior to being washed, and refed with new medium lacking U18666A. Some cultures were stained with AO either at the time of washout, or 24, 48 and 96 h post medium change. (C) A parallel set of cultures were sensitized with 33 µM NPe6 and photoirradiated prior to being stained with AO and monitored by fluorescence microscopy. Treatments are noted in the figure. (D) Some 1c1c7 cultures were treated with nothing, light only, or 33 µM NPe6 only for 1 h prior to being stained with AO. Additional cultures were loaded with NPe6 for 1 h, washed and refed, and irradiated. Cultures were stained with AO 1 h later. Treatments are noted in the figure. Results similar to those reported in panels A, B, C and D were obtained in 4, 2, 2 and 3 additional independent experiments, respectively. White bar represents 20 microns.
Figure 5
Figure 5
U18666A-, imipramine- and clozapine-mediated inhibition of apoptosis initiated by photoirradiation of NPe6-sensitized cultures. 1c1c7 cultures were treated with nothing (NT) or different concentrations of U18666A (UA), imipramine (IPM), or clozapine (CZP) for ~24 h prior to being sensitized with 33 µM NPe6. Sensitized cultures were photoirradiated 1 h later for 80s. Cultures were harvested for analyses of DEVDase activities (A–C) or procaspase-9 and -3 cleavage (D) at indicated times after photoirradiation. Data in panels A–C represent means of triplicate analyses performed with the lysate of a single culture. The studies reported in panels A–C were repeated minimally a second time with similar results. The western blots in panel D employed 25 µg of cellular lysate per lane.
Figure 6
Figure 6
U18666A suppresses PDT-induced oxidation of C11-BODIPY. (A) 1c1c7 cultures were exposed to 4 µM C11-BODIPY (C11) for 1 h prior to replacing medium and examination by fluorescence microscopy for the distribution of reduced (red) and oxidized (green) C11. (B) 1c1c7 cultures were treated with C11 as described above. LysoSensor Green (LSG, 2 µM) was added during the final 10 min of incubation. After changing the medium the cultures were imaged to capture red (C11) and green (LSG) fluorescence. C11 colocalization with LSG is indicated by the occurrence of punctate yellow/orange spots in the overlay. (C) Cultures were cotreated with 40 µM NPe6 and 4 µM C11 for 1 h prior to being washed, refed, and photoirradiated for 60s. After photoirradiation the cultures were immediately imaged for detection of C11 fluorescence. (D) Cultures were treated with 0.75 µM U18666A for ~20 h prior to the addition of C11, and subsequently analyzed as described above. (E) Cultures were treated as in panel C except that they were incubated with 0.75 µM U18666A for ~20 h prior to the additions of NPe6 and C11. A second experiment yielded similar results for all treatment groups. White bar in panel A represents 20 microns.
Figure 7
Figure 7
PDT-induced oxidation of lysosomal cholesterol. (A) 1c1c7 cultures were not treated (NT) or exposed to 0.1 or 0.75 µM U18666A (UA) for ~20 h prior to being washed and refed with medium containing 33 µM NPe6. After 2 h of sensitization the cultures were washed, refed and photoirradiated for either 60 or 120 s. Cultures were fixed 30 min later and processed for filipin binding and fluorescence. White bar represents 20 microns. (B) Cultures were treated as described above except that photoirradiation times varied between 30 to 120 s. Data represent per cell filipin fluorescence intensities ± S.D. of 20–48 cells taken from multiple fields. The circles represent UA-treated cultures and the triangles represent NT cultures. The per cell filipin fluorescence intensity of every photoirradiated UA treatment group (at all light exposures) was statistically less (P<0.05) than the intensity measured in non-photoirradiated, UA-treated cultures. Results similar to that reported for cultures pretreated with 0.75 µM UA were obtain in two additional experiments. Exposure settings for the capture of filipin fluorescence were uniform within an experiment, and initially set so as to yield a strong signal for non-irradiated, UA-treated cultures. The experiments involving pretreatment with either 0.1 or 0.75 µM UA18666A were performed and analyzed on different days. Hence, per cell intensity units are not directly comparable between experiments.
Figure 8
Figure 8
U18666A-mediated suppression of H2O2-induced LMP and DEVDase activation. (A) 1c1c7 cultures were incubated with 100, 150 or 200 µM H2O2 for different lengths of time prior to being harvested for subsequent analyses of DEVDase activities. (B) 1c1c7 cultures were incubated with different concentrations of U18666A (UA) for ~24 h prior to being washed and refed with medium containing 150 µM H2O2. Cultures were harvested at various times after peroxide addition for analyses of DEVDase activities. Data in panels A and B represent means of triplicate analyses performed with the lysate of a single culture. Treatments are noted in the figure. Results similar to those reported in panels A and B were obtained in minimally three additional independent experiments. (C) 1c1c7 cultures were treated with nothing or 1 µM U18666A for ~20 h prior to being washed and refed with medium lacking or containing 150 µM H2O2. Cultures were stained with AO 4 or 6 h after medium change and monitored by fluorescence microscopy. Treatments are noted in the figure. Similar results were obtained in a second experiment. White bar represents 20 microns.
Figure 9
Figure 9
U18666A does not suppress the pro-apoptotic activities of agents that do not induce LMP. 1c1c7 cultures were treated with nothing, 1 µM U18666A (UA), or 12.5 µM imipramine (IPM) for ~20 h. Some cultures were subsequently treated with 25 µM HA14-1 (A,D), 25 nM thapsigargin (B,E), or 100 nM staurosporine (C,F). Cultures were harvested at various times after toxicant treatment for analyses of DEVDase activities. Treatments are noted in the figure. Data points represent the means of triplicate analyses performed with the lysate of a single culture. Similar results were obtained in a second independent experiment.

References

    1. Johansson A-C, Appelqvist H, Nilsson C, Kagedal K, Roberg K, Öllinger K. Regulation of apoptosis-associated lysosomal membrane permeabilization. Apoptosis. 2010;15:478–484. - PMC - PubMed
    1. Guicciardi ME, Leist M, Gores GJ. Lysosomes in cell death. Oncogene. 2004;23:2881–2890. - PubMed
    1. Kirkegaard T, Jäättelä M. Lysosomal involvement in cell death and cancer. Biochim. Biophys. Acta. 2009;1793:746–754. - PubMed
    1. Dare E, Li W, Zhivotorsky B, Yuan S, Ceccatelli S. Methyl mercury and H2O2 provoke lysosomal damage in human astrocytoma D384 cells followed by apoptosis. Free Radic. Biol. Med. 2001;30:1347–1356. - PubMed
    1. Kurtz T, Gustafsson B, Brunk UT. Intralysosomal iron chelation protects against oxidative stress-induced cellular damage. FEBS J. 2006;273:3106–3117. - PubMed

Publication types

MeSH terms