. 2010 Nov 16;19(5):765-77.
doi: 10.1016/j.devcel.2010.10.010.

Integration of brassinosteroid signal transduction with the transcription network for plant growth regulation in Arabidopsis

Affiliations

Integration of brassinosteroid signal transduction with the transcription network for plant growth regulation in Arabidopsis

Yu Sun et al. Dev Cell. .

Abstract

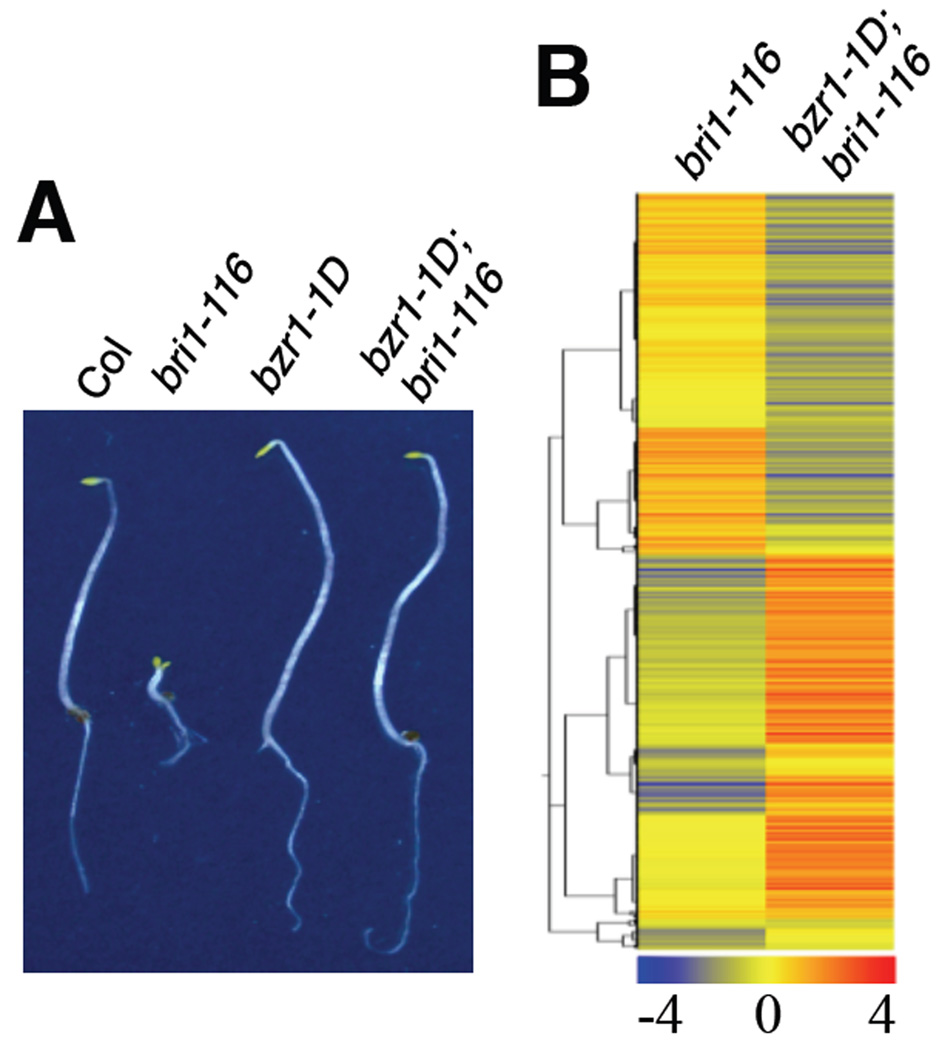
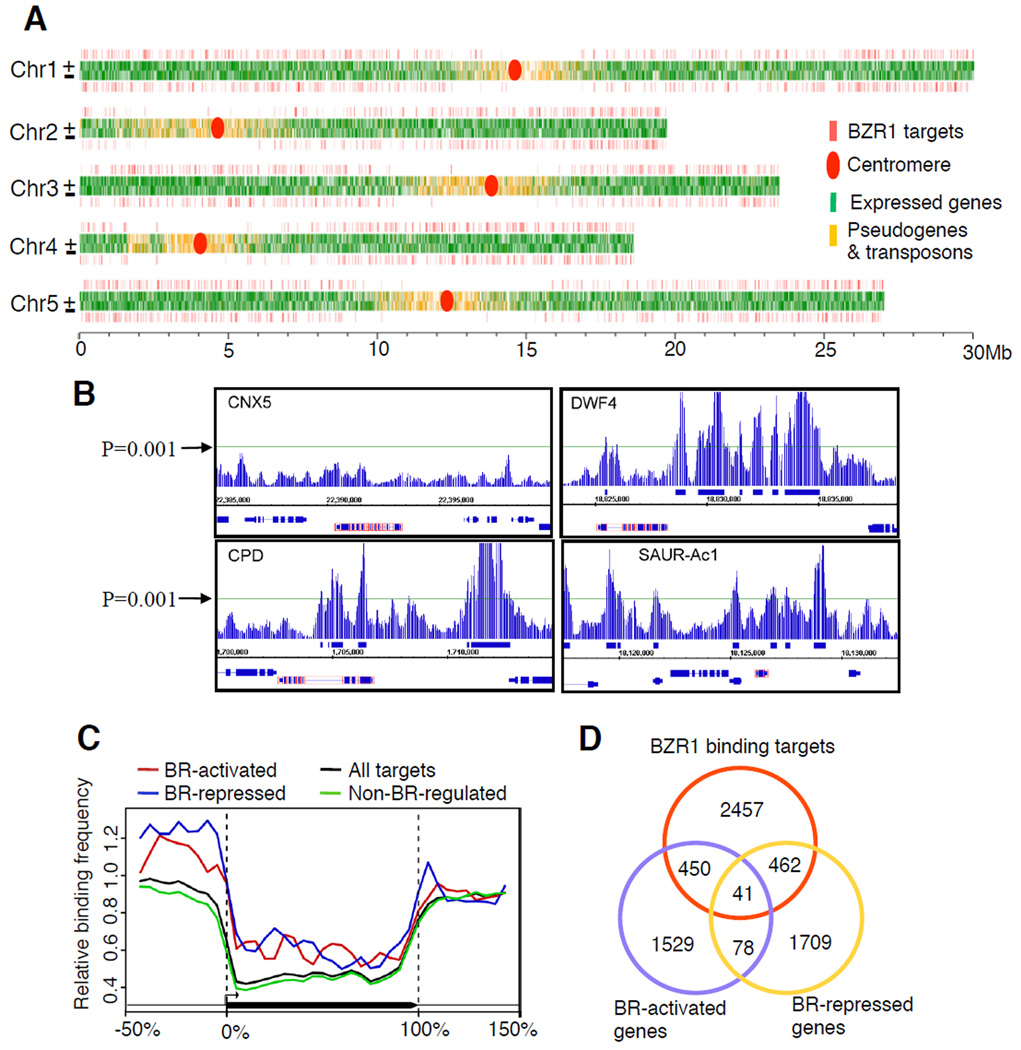
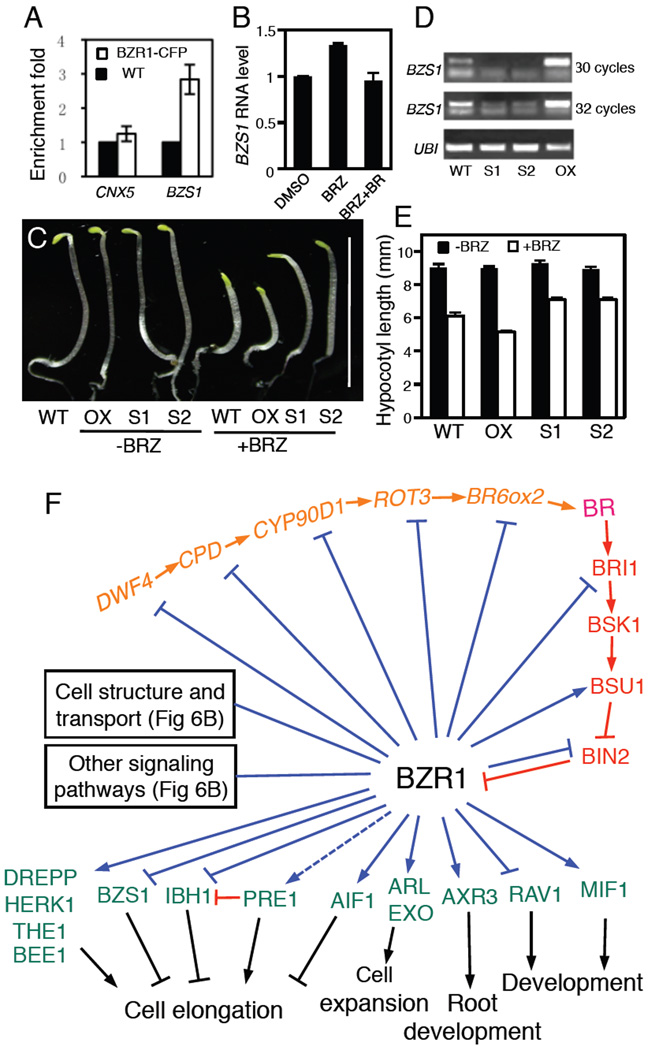
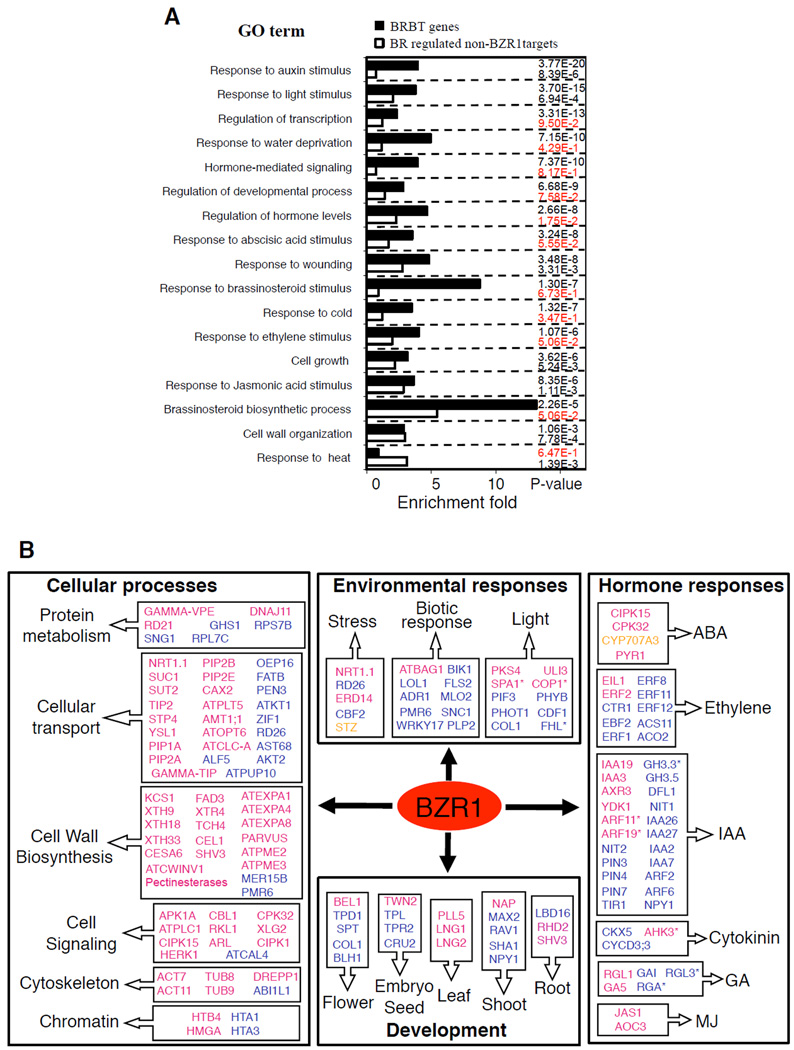
Brassinosteroids (BRs) regulate a wide range of developmental and physiological processes in plants through a receptor-kinase signaling pathway that controls the BZR transcription factors. Here, we use transcript profiling and chromatin-immunoprecipitation microarray (ChIP-chip) experiments to identify 953 BR-regulated BZR1 target (BRBT) genes. Functional studies of selected BRBTs further demonstrate roles in BR promotion of cell elongation. The BRBT genes reveal numerous molecular links between the BR-signaling pathway and downstream components involved in developmental and physiological processes. Furthermore, the results reveal extensive crosstalk between BR and other hormonal and light-signaling pathways at multiple levels. For example, BZR1 not only controls the expression of many signaling components of other hormonal and light pathways but also coregulates common target genes with light-signaling transcription factors. Our results provide a genomic map of steroid hormone actions in plants that reveals a regulatory network that integrates hormonal and light-signaling pathways for plant growth regulation.


Figures

Figure 1
Figure 1. BZR1 is a major transcription factor of the BRI1 signaling pathway
(A) Phenotypes of wild type (Col), bri1-116, bzr1-1D, and bzr1-1D;bri1-116 double mutant seedlings grown in the dark for 5 days. (B) Hierarchical cluster analysis of the genes differentially expressed in bri1-116 vs Col and bzr1-1D;bri1-116 vs bri1-116. The numerical values for the blue-to-red gradient bar represent log2-fold change relative to the control sample. Genes are listed in Table S1.
Figure 2
Figure 2. Identification of BZR1 direct target genes using ChIP-chip
(A) Distribution of BZR1 binding sites along the five chromosomes of Arabidopsis. (B) ChIP-chip data displayed by Integrated Genome Browser software at selected chromosomal regions around known BZR1 target and non-target genes (red-box). The horizontal line indicates the cut off P-value (0.001). (C) Frequency of BZR1 binding sites along the virtually normalized gene models (promoter is −50-0%, coding region 0–100%, 3’ region 100–150%) of each class of BZR1 target genes. (D) Venn diagram shows the overlaps of BZR1 target genes (Table S2a) with BR-activated and BR-repressed genes (Table S5c).
Figure 3
Figure 3. BZR1 functions as both transcriptional activator and repressor
(A) ChIP-qPCR analyses of BZR1-CFP and BES1-GFP binding to DWF4 and SAUR-AC1 promoters relative to the control gene (CNX5). Error bars indicate standard error for three biological repeats. (B) Quantitative data of competition electrophoretic mobility shift assays of BZR1 and BES1 binding to the BRRE elements in the CPD and SAUR-AC1 (BRRE) promoters and the E-box of the SAUR-AC1 promoter. (C) Motif analysis of BR-activated and repressed BZR1 target genes. All data are significantly different from genomic control (binomic P-value <0.01)
Figure 4
Figure 4. BZR1 directly activates the expression of DREPP to promote cell elongation
(A) ChIP-chip data displayed by Integrated Genome Browser software shows BZR1 binding at the DREPP promoter. (B) ChIP-qPCR analysis of BZR1 binding to DREPP relative to the control gene CNX5. Error bars indicate standard deviation in 3 biological repeats. (C) Reverse transcription PCR (RT-PCR) analysis of DREPP RNA levels in 7-day-old seedlings after various time of treatment with 100 nM BL or mock solutions. (D) Confocal microscopy image of DREPP-GFP in epidermal cells of transgenic Arabidopsis. (E) Overexpression of DREPP increases cell elongation. Three-week-old seedlings of det2 (upper images) and transgenic det2 overexpressing DREPP (lower images) and scanning electron microscopy images of epidermal cells of the petioles.
Figure 5
Figure 5. BRBT genes play important roles in BR-regulated plant growth
(A) ChIP-qPCR analysis of BZR1 binding to the BZS1 promoter relative to the control gene CNX5. Average of 3 biological repeats with standard deviation. (B) Expression of BZS1 is induced by BRZ and repressed by BR. Error bars indicate standard error of the mean. (C) Phenotypes of 5-day-old BZS1 over-expression line (OX) and two co-suppressed lines (S1 and S2) grown in the dark on medium with or without 1 µM BRZ. Scale bar indicates 10 mm. (D) RT-PCR analysis of BZS1 RNA level of the transgenic lines in panel (C). (E) Measurement of hypocotyl lengths of seedlings as shown in panel C, represented as mean +/− standard error from over 30 seedlings. (F) A diagram of the BR pathway. The BR biosynthetic enzymes are shown in orange color, the BR signaling components in red, and downstream components with demonstrated BR-related functions in green. Red arrows and bar ends show activation and inhibition at the protein level. Blue arrows and bar ends show BZR1 binding to BR-activated and repressed genes, respectively, and dashed line indicates finding from previous studies.
Figure 6
Figure 6. Functional classification analysis of the BR-regulated BZR1 target and non-target genes
(A) Enrichment of selected GO categories in BRBT and BR-regulated non-BZR1 target genes. Numbers on the right are P-values corresponding to the categories on the left (P values >0.01 are in red). (B) Representative BRBTs with known functions (Table S2a, BRBTs with demonstrated function) in various cellular processes and response/regulatory pathways. Genes repressed and activated by BR or in the bzr1-1D mutant are in blue and red color, respectively; genes responded in opposite ways in different microarray experiments are in orange. Genes only differently expressed in the bzr1-1D mutant but not affected by bri1 or BR treatment are marked with asterisk.
Figure 7
Figure 7. Crosstalk between light and BR pathways in regulating gene expression
(A) Western analysis of PHYB protein level in 5-day-old etiolated BR mutants. (B) Venn diagram shows the overlap of differentially expressed genes in BR mutants (as in Table S1a) and light. (C) Hierarchical cluster analyses of selected genes differentially expressed in either wild type seedlings grown under red light (RL) or dark-grown BR mutants (bri1-116 and bzr1-1D;bri1-116, genes listed in Table S1a), compared to dark-grown wild type control seedlings. Genes are selected as differentially expressed in both red light and the BR mutants. The numerical values for the blue-to-red gradient bar represent log2-fold change relative to the control sample. (D) Overlap of BZR1 targets with HY5 targets, the overlapped genes are listed in Table S6b column A. (E) Regulation of BZR1-HY5 co-targeted genes by BR and RL. (F) Overlap of BZR1 target genes with PIL5 target genes (genes listed in Table S6c). (G) Regulation of co-target genes of BZR1 and PIL5 by BR and PIL5. In (B, D, F), “+” indicates activation and “−” indicates repression by BR or RL. (H) A model for BR-light interaction in seed germination and seedling growth, with arrows showing positive regulation and bar ends showing negative regulation.

References

    1. Blauwkamp TA, Chang MV, Cadigan KM. Novel TCF-binding sites specify transcriptional repression by Wnt signalling. EMBO J. 2008;27:1436–1446. - PMC - PubMed
    1. Chapman EJ, Estelle M. Mechanism of auxin-regulated gene expression in plants. Annu Rev Genet. 2009;43:265–285. - PubMed
    1. Chory J, Nagpal P, Peto CA. Phenotypic and Genetic Analysis of det2, a New Mutant That Affects Light-Regulated Seedling Development in Arabidopsis. Plant Cell. 1991;3:445–459. - PMC - PubMed
    1. Chung HS, Howe GA. A critical role for the TIFY motif in repression of jasmonate signaling by a stabilized splice variant of the JASMONATE ZIM-domain protein JAZ10 in Arabidopsis. Plant Cell. 2009;21:131–145. - PMC - PubMed
    1. Clouse SD, Sasse JM. BRASSINOSTEROIDS: Essential Regulators of Plant Growth and Development. Annu Rev Plant Physiol Plant Mol Biol. 1998;49:427–451. - PubMed

Publication types

MeSH terms

Associated data