. 2011 Mar;25(3):443-60.
doi: 10.1016/j.bbi.2010.11.005. Epub 2010 Nov 12.

Ascending caudal medullary catecholamine pathways drive sickness-induced deficits in exploratory behavior: brain substrates for fatigue?

Affiliations

Ascending caudal medullary catecholamine pathways drive sickness-induced deficits in exploratory behavior: brain substrates for fatigue?

Ronald P A Gaykema et al. Brain Behav Immun. 2011 Mar.

Abstract

Immune challenges can lead to marked behavioral changes, including fatigue, reduced social interest, anorexia, and somnolence, but the precise neuronal mechanisms that underlie sickness behavior remain elusive. Part of the neurocircuitry influencing behavior associated with illness likely includes viscerosensory nuclei located in the caudal brainstem, based on findings that inactivation of the dorsal vagal complex (DVC) can prevent social withdrawal. These brainstem nuclei contribute multiple neuronal projections that target different components of autonomic and stress-related neurocircuitry. In particular, catecholaminergic neurons in the ventrolateral medulla (VLM) and DVC target the hypothalamus and drive neuroendocrine responses to immune challenge, but their particular role in sickness behavior is not known. To test whether this catecholamine pathway also mediates sickness behavior, we compared effects of DVC inactivation with targeted lesion of the catecholamine pathway on exploratory behavior, which provides an index of motivation and fatigue, and associated patterns of brain activation assessed by immunohistochemical detection of c-Fos protein. LPS treatment dramatically reduced exploratory behavior, and produced a pattern of increased c-Fos expression in brain regions associated with stress and autonomic adjustments paraventricular hypothalamus (PVN), bed nucleus of the stria terminalis (BST), central amygdala (CEA), whereas activation was reduced in regions involved in exploratory behavior (hippocampus, dorsal striatum, ventral tuberomammillary nucleus, and ventral tegmental area). Both DVC inactivation and catecholamine lesion prevented reductions in exploratory behavior and completely blocked the inhibitory LPS effects on c-Fos expression in the behavior-associated regions. In contrast, LPS-induced activation in the CEA and BST was inhibited by DVC inactivation but not by catecholamine lesion. The findings support the idea that parallel pathways from immune-sensory caudal brainstem sources target distinct populations of forebrain neurons that likely mediate different aspects of sickness. The caudal medullary catecholaminergic projections to the hypothalamus may significantly contribute to brain mechanisms that induce behavioral "fatigue" in the context of physiological stressors.


Figures

Figure 1
Figure 1
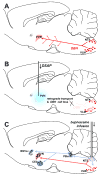
A,B. The destruction of caudal brainstem catecholaminergic projection neurons by micro-injection of the toxin saporin conjugated to anti-DBH into the PVN, which is densely innervated by VLM and NTS noradrenergic and adrenergic neurons (red filled dots and arrows in A), resulting in a loss of such neurons and their axonal projections to the PVN (indicated as open dots in B), with concomitant loss of collateral innervation of additional regions in fore- and midbrain. C. Functional inactivation of the dorsal vagal complex (DVC, including the NTS) which gives rise to non-catecholaminergic projections (in blue) via the PBel to the BST and the CEA, and direct catecholaminergic projections to the PVN (in red).
Figure 2
Figure 2
A. LPS challenge-induced inhibition of open field exploration is largely reversed by DSAP lesion of noradrenergic projections from the caudal brainstem to the hypothalamus. These effects are reflected in the total distance moved (A) and average velocity (B). Pair-wise comparisons after significant interaction in 2-way ANOVA are as follows: i.p. LPS vs. saline injections: *, p < 0.05, *** p < 0.0001; DSAP lesion vs. SAP control: ### p < 0.0005.
Figure 3
Figure 3
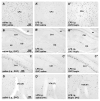
Prominent exploratory behavior-associated c-Fos expression: DSAP lesion prevents suppression of c-Fos expression by LPS challenge. Representative images from saline-injected rats (left column) show strong c-Fos expression after open field exploration, compared to diminished c-Fos expression in LPS-challenged SAP control rats (middle column), but not in LPS-treated DSAP rats (right column). Regions that show these LPS and DSAP effects include the dorsomedial portion of the caudate putamen (CPu, A-A″), the dorsal hippocampus (B-B″) with a close-up of the the pyramidal cell layer in cornu ammonis in (CA1, C-C″), the lateral and perifornical parts of the hypothalamus (LH, PF, D-D″) where many orexin-A (Orx-A)-positive neurons express c-Fos (inserted micrographs), the ventral tuberomammillary nucleus (VTM, E-E″ and F-F″) harboring histaminergic neurons (E2 and E3 cell groups; inserts show the c-Fos expression within the HDC-labeled somata), and the rostral part of the ventral tegemental area (VTA) and its interfascicular portion (IF), where c-Fos expression is also present within TH-labeled dopaminergic neurons (inserts). The color photomicrograph images depicted in the inserts (D-G″) were taken from series of double-stained sections adjacent to those in the main panels stained for c-Fos IR only. Scale bars are in micrometers. Other abbreviations: DG, dentate gytus; ec, external capsule; Hil, hilus.
Figure 3
Figure 3
Prominent exploratory behavior-associated c-Fos expression: DSAP lesion prevents suppression of c-Fos expression by LPS challenge. Representative images from saline-injected rats (left column) show strong c-Fos expression after open field exploration, compared to diminished c-Fos expression in LPS-challenged SAP control rats (middle column), but not in LPS-treated DSAP rats (right column). Regions that show these LPS and DSAP effects include the dorsomedial portion of the caudate putamen (CPu, A-A″), the dorsal hippocampus (B-B″) with a close-up of the the pyramidal cell layer in cornu ammonis in (CA1, C-C″), the lateral and perifornical parts of the hypothalamus (LH, PF, D-D″) where many orexin-A (Orx-A)-positive neurons express c-Fos (inserted micrographs), the ventral tuberomammillary nucleus (VTM, E-E″ and F-F″) harboring histaminergic neurons (E2 and E3 cell groups; inserts show the c-Fos expression within the HDC-labeled somata), and the rostral part of the ventral tegemental area (VTA) and its interfascicular portion (IF), where c-Fos expression is also present within TH-labeled dopaminergic neurons (inserts). The color photomicrograph images depicted in the inserts (D-G″) were taken from series of double-stained sections adjacent to those in the main panels stained for c-Fos IR only. Scale bars are in micrometers. Other abbreviations: DG, dentate gytus; ec, external capsule; Hil, hilus.
Figure 4
Figure 4
Exploratory behavior-associated c-Fos expression (left panels A-D, i.p. saline controls) is suppressed by i.p. LPS challenge in rats when infused intra-DVC with saline (middle column A′-D′), but not in rats that received prior intra-DVC bupivacaine (right column A″-D″). Brain regions that show strong exploration-related c-Fos expression include the dorsomedial portion of the caudate putamen (CPu, A-A″), the hippocampus (B-B″) with in particular an effect the pyramidal cell layer in the CA1 (C-C″), and the rostral VTA and IF in D-D″. Scale bar in micrometers. Abbreviations are as in Fig. 3.
Figure 5
Figure 5
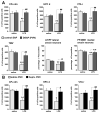
Effects of LPS challenge and the impact of prior DSAP lesion (A) and bupivacaine infusion into the DVC (B, bottom row) on brain c-Fos expression in rats exposed to a novel environment (open field in A, EPM in B). Bar graphs depict mean +/- SEM of total counts of c-Fos-ir profiles in selected brain regions that show prominent c-Fos induction associated with behavioral activity, including: the dorsomedial CPu, the dorsal hippocampus (HPC d), the rostral VTA, the TMV, and the orexin cells extending throughout the LH and PF and into the adjoining dorsomedial hypothalamus (DMH) divided in lateral and medial portions (the latter expressed as percentage of the total numbers of orexin cells; the latter were not different between groups). Pair-wise comparisons after significant interaction in 2-way ANOVA are as follows: i.p. LPS vs. saline injections: *, p < 0.05, **, p < 0.005, *** p < 0.0001; DSAP lesion vs. SAP control (in A) or DVC bupivacaine vs. saline (in B): #, p < 0.05, ##, p < 0.005.
Figure 6
Figure 6
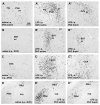
LPS-induced c-Fos expression in autonomic and interoceptive stress-related regions is selectively inhibited in the hypothalamic paraventricular nucleus (PVN) by DSAP lesion. Compared to saline injection, LPS challenge in SAP controls induced marked increases in c-Fos expression in the parvocellular part (pv) of the PVN (A,A′), the lateral central amygdala (CEA; B,B′), the oval bed nucleus of the stria terminalis (BST ov; C,C′), and the external lateral portion of the parabrachial nucleus (PBel; D,D′). DSAP lesion greatly blunted c-Fos induction in the PVN (A″) as compared to the SAP control (A′), but had no effect on LPS-induced c-Fos induction within the other regions (B″-D″). The left panels depict the much lower levels of c-Fos expression in these regions related to the behavioral exploration task (A-D, left panels). Scale bar in A is in micrometers (applies to all panels). Other abbreviations: 3V, third ventricle; LV, lateral ventricle, mg, magnocellular division; PBcl, central lateral division of the parabrachial nucleus; scp, superior cerebellar peduncle (brachium conjunctivum).
Figure 7
Figure 7
LPS-induced c-Fos expression in autonomic and interoceptive stress-related regions was inhibited by DVC inactivation with bupivacaine. Brain regions that showed marked increase in c-Fos expression after LPS challenge include the PVN (A,A′), the lateral CEA (B,B′), the oval/dorsolateral BST (C,C′), and the PBEL (D,D′). Bupivacaine-infused rats showed greatly blunted c-Fos induction in the PVN (A″), the CEA (B″), BST ov (C″), and PBEL (D″). Scale bar in A is in micrometers (applies to all panels). Abbreviations are as in Fig. 7.
Figure 8
Figure 8
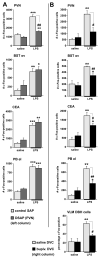
Effects of LPS challenge and the impact of prior DSAP lesion (A) and bupivacaine infusion into the DVC (B) on brain c-Fos expression in rats exposed to a novel environment (open field in A, EPM in B). Bar graphs depict mean +/- SEM of total counts of c-Fos-ir profiles in selected brain regions that show prominent c-Fos induction in response to LPS challenge, including the PVN, the oval BST, the lateral CEA, and external lateral portions of the PB. DSAP lesion suppresses LPS-induced c-Fos expression only in the PVN (A), whereas DVC inactivation inhibits LPS-related c-Fos induction in each of the brain regions (B) as well as in the DBH-positive neurons of the VLM (expressed as the percentage of the total numbers of DBH cells; total numbers were not different between groups). Pair-wise comparisons after significant interaction in 2-way ANOVA are as follows: i.p. LPS vs. saline injections: *, p < 0.05, **, p < 0.005, *** p < 0.0001; DSAP lesion vs. SAP control (in A) or DVC bupivacaine vs. saline (in B): #, p < 0.05, ##, p < 0.005.
Figure 9
Figure 9
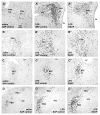
Effects of DSAP microinjection aimed at the PVN on the LPS-responsive DBH-immunoreative somata in the brainstem. Coronal sections depict both DBH immunolabeling of somata (brown) as well as LPS-induced c-Fos expression (black nuclear stain). In the NTS, loss of DBH somata is modest at the level of the AP but fewer double-labeled cells remain (A). In contrast, most of the double-labeled cells were lost in especially the middle portion of the VLM in DSAP animals (B). In the locus coeruleus (LC) just deep to the fourth ventricle (4V), DBH-ir cells were abundant in both SAP control and DSAP rats (C), indicative of the minimal loss of noradrenergic cells following DSAP injection into the medial hypothalamus. Similarly, no depletion of DBH cells was found in the other noradrenergic cell groups of the rostral medulla and pons (A5 and A7 cell groups, not shown).
Figure 10
Figure 10
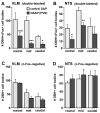
Quantitative analysis of DBH-immunoreactive somata in the VLM and NTS in LPS-treated SAP control and DSAP rats reveal a significant loss of c-Fos-DBH double-labeled neurons (A,B) but not c-Fos-negative DBH cells (C,D). In the VLM, loss of double-labeled neurons occurred at all levels although most prominently in the middle and caudal portions, whereas the rostral-most portion of the VLM showed limited loss of double-labeled cells in DSAP rats. The loss of double-labeled neurons in the NTS was significant in the rostral and mid-portions (at the level of the AP), but not in the caudal (commissural) NTS. DSAP effects: *, p < 0.05, **, p < 0.005, *** p < 0.0001.
Figure 11
Figure 11
The extent of the depletion of catecholaminergic innervation as a result of micro-injection of DSAP aimed at the PVN. Photomicrographs arranged in pairs from representative SAP control rats (panels A-I) and DSAP lesioned rats (A′-J′) show DBH-ir fiber and terminal labeling and the extent of the depletion due to DSAP lesion in the hypothalamus (A-E) and neighboring fore- and midbrain regions (F-I). Within the hypothalamus, depletion of DBH-ir extended beyond the PVN to the anterior hypothalamic area (AHA), lateral (LH), perifornical (PF), and dorsomedial (DMH) areas (A′-C′), as well as the ventral tuberomammilary nucleus (TMV in D′,E′), which latter contains E2 and E3 histaminergic neurons within the dense DBH-ir plexus (shown in more detail in Gaykema et al., 2008). The extra-hypothalamic regions affected by DSAP include the paraventricular thalamus (PVT in F,F′), ventral tegmental area (VTA), lateral and ventrolateral periaqueductal grey (LPAG, VLPAG in G,H), and retrorubal field (RRF in I), all of which show partial depletion. Scale bars are in micrometers. Other abbreviations: 3V, third ventricle; Aq, aquaduct, DR, dorsal raphe; PMD, dorsal premammillary nucleus; PMV, ventral premammillary nucleus.
Figure 12
Figure 12
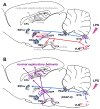
Model diagrams outlining potential brain substrates and mechanisms that underlie sickness behavior in response to systemic inflammatory insult (LPS challenge). Panel A depicts the two parallel pathways arising in the caudal brainstem: one non-catecholaminergic that involves the PBel, CEA, and BSTov (in blue), and a catecholaminergic (noradrenergic and adrenergic) pathway aimed at the PVN with collaterals aimed at other regions (in red). The latter involves some of the brain regions that show inhibition of c-Fos expression such as the LH/PF, TMV, and VTA. Inhibition of c-Fos expression (indicated with lighter grey dots) also occurs in the caudate putamen (CPu) and hippocampus (HPC). Suppressed neuronal activity in all these regions may underlie the illness-associated reduced behavioral activity in the exploration task. Panel B shows the effect of DSAP lesion that destroys the ascending catecholaminergic pathway with loss of noradrenergic and adrenergic cell bodies in the NTS and VLM (indicated with red dots). This lesion results in suppression of LPS-induced activation in the PVN (light grey dots in B) and the prevention of suppression of behavioral task-related neuronal activation in LH/PF, TMV, VTA, CPu and HPC (indicated with black dots in B). Unlike after DVC inactivation that blunted the response of the non-catecholaminergic PBel-CEA-BSTov pathway to LPS, DSAP lesion did not affect the response to LPS by this latter pathway, which therefore does not seem to mediate behavioral inhibition.

Similar articles

Cited by

References

    1. Balleine BW, O'Doherty JP. Human and rodent homologies in action control: Corticostriatal determinants of goal-directed and habitual action. Neuropsychopharmacology. 2010;35:38–69. - PMC - PubMed
    1. Banihashemi L, Rinaman L. Noradrenergic inputs to the bed nucleus of the stria terminalis and paraventricular nucleus of the hypothalamus underlie hypothalamic–pituitary–adrenal axis but not hypophagic or conditioned avoidance responses to systemic yohimbine. J Neurosci. 2006;26:11442–11453. - PMC - PubMed
    1. Belevych N, Buchanon K, Chen Q, Bailey M, Quan N. Location-specific activation of the paraventricular nucleus of the hypothalamus by localized inflammation. Brain Behav Immun. 2010;24:1137–1147. - PMC - PubMed
    1. Bienkowski MS, Rinaman L. Noradrenergic inputs to the paraventricular hypothalamus contribute to hypothalamic-pituitary-adrenal axis and central Fos activation in rats after acute systemic endotoxin exposure. Neurosci. 2008;156:1093–1102. - PMC - PubMed
    1. Cunningham ET, Jr, Bohn MC, Sawchenko PE. Organization of adrenergic inputs to the paraventricular and supraoptic nuclei of the hypothalamus in the rat. J Comp Neurol. 1990;292:651–667. - PubMed

Publication types

MeSH terms