. 2010 Nov 18;8(5):410-21.
doi: 10.1016/j.chom.2010.10.007.

Mouse STAT2 restricts early dengue virus replication

Affiliations

Mouse STAT2 restricts early dengue virus replication

Joseph Ashour et al. Cell Host Microbe. .

Abstract

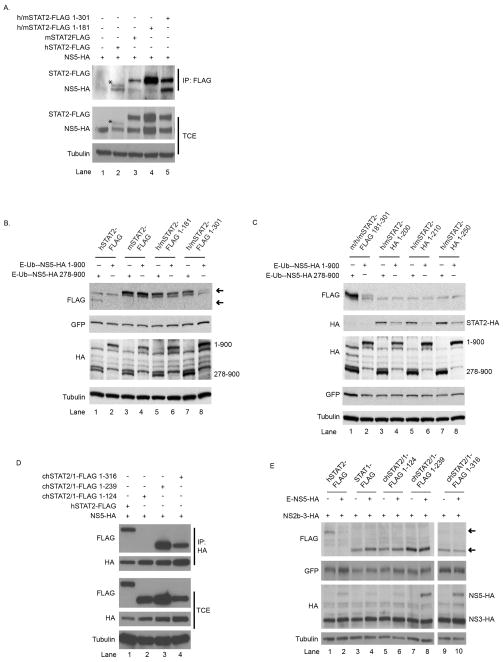
Dengue virus encodes several interferon antagonists. Among these the NS5 protein binds STAT2, a necessary component of the type I interferon signaling pathway, and targets it for degradation. We now demonstrate that the ability of dengue NS5 to associate with and degrade STAT2 is species specific. Thus, NS5 is able to bind and degrade human STAT2, but not mouse STAT2. This difference was exploited to demonstrate, absent manipulation of the viral genome, that NS5-mediated IFN antagonism is essential for efficient virus replication. Moreover, we demonstrate that differences in NS5 mediated binding and degradation between human and mouse STAT2 maps to a region within the STAT2 coiled-coil domain. By using STAT2(-/-) mice, we also demonstrate that mouse STAT2 restricts early dengue virus replication in vivo. These results suggest that overcoming this restriction through transgenic mouse technology may help in the development of a long-sought immune-competent mouse model of dengue virus infection.


Figures

Fig. 1
Fig. 1
NS5 mediated STAT2 degradation is species specific and does not require additional species specific host factors. A. 2FTGH, U6A, U6A (hSTAT2-FLAG), U6A (mSTAT2-FLAG), wtMEF’s, STAT2−/− MEF, STAT2−/− (hSTAT2-FLAG) and STAT2−/− (mSTAT2-FLAG) were treated with 100u/mL Type-I IFN. 24hpt, cells were challenged with NDV-GFP. Virus replication levels were recorded 12hpi by live microscopy. B. U6A cells or U6A-hSTAT2-FLAG or U6A-mSTAT2-FLAG cells were infected with DENV at an MOI of 10. 24hpi, cells were lysed and levels of protein analyzed by SDS-PAGE and immune-blotting using antibodies against FLAG, NS5 and Tubulin. C. U6A cells were co-transfected with the given constructs. 24hpt, cells were lysed and levels of protein analyzed by SDS-PAGE and immune-blotting using antibodies against FLAG, GFP, HA and Tubulin. D. wtMEF’s, STAT2−/−, STAT2−/− (-hSTAT2-FLAG) or STAT2−/− (-mSTAT2-FLAG) cells were infected with DENV at an MOI of 10. 24hpi, cells were lysed and levels of protein analyzed by SDS-PAGE and immune-blotting using antibodies against FLAG, NS5, mSTAT2 and Tubulin. E. BHK21 cells were co-transfected with the given constructs. 24hpt, cells were lysed and levels of protein analyzed by SDS-PAGE and immune-blotting using antibodies against FLAG, GFP, HA and Tubulin. F. 2FTGH cells or 2FTGH derivatives (U6A, U3A and U2A) were infected with DENV at an MOI of 10. 24hpi cells were lysed and analyzed by SDS-PAGE and immune-blotting using antibodies against STAT2, NS5 and Tubulin. Asterisk denotes residual signal from immune-blot against STAT2. All western blots and microscopy data are representative of experiments performed several times. Upper arrows indicate FLAG-tagged mSTAT2 expected migration. Lower arrows indicate FLAG-tagged hSTAT2 expected migration. See also Fig. S1.
Fig. 2
Fig. 2
NS5 associates with hSTAT2 but not mSTAT2. A. BHK21 cells were transfected with plasmids encoding for FLAG tagged STAT1 and STAT2, and HA tagged NS5 proteins. Cells were lysed 24hpt and immune-precipitation was performed against the HA epitope. Immune-precipitated samples and the total cell extracts were analyzed by SDS-PAGE and immune-blotting using antibody against FLAG, HA and Tubulin. B. 293T cells were transfected with plasmids encoding for FLAG tagged STAT1, STAT2 and IRF9 proteins. 24hpt, cells were infected with DENV at an MOI of 10. 24hpi, cells were lysed and immune-precipitation was performed against the FLAG epitope. Immune-precipitated samples and the total cell extract were analyzed b SDS-PAGE and immune-blotting using antibodies against FLAG, NS5 and Tubulin. C. Plasmids encoding for STAT1, hSTAT2, mSTAT2 and NS5 proteins were transfected into BHK21 cells. 24hpt, cells were live imaged for GFP fluorescence (top panels) and subsequently fixed for immune-staining using antibody against HA (secondary FITC fluorophore) and FLAG (secondary Texas Red fluorophore) epitopes as well as DAPI stain to visualize DNA. Panels 2 and 3 are 10X images of the cells after fixing and staining for NS5 and the STAT protein. The lower three panels are from the same experiment (though not necessarily from the same field as panels 2 and 3) and have been enlarged for easy visualization of the cytoplasmic and nuclear compartments. D. Same as A. All western blots and microscopy data are representative of experiments performed several times.
Fig. 3
Fig. 3
NS5 inhibits hSTAT2 mediated signaling but not mSTAT2 mediated signaling. A. 293T cells were co-transfected with increasing amounts of hISGF3-FLAG (hSTAT2-FLAG, STAT1-FLAG and IRF9-FLAG) or mISGF3-FLAG (mSTAT2-FLAG, STAT1-FLAG and IRF9-FLAG) plus ISRE-CAT-GFP, pCAGGS-Firefly luciferase and either E-Ub-NS5-HA 278-900, E-Ub-NS5-HA 10-900 or E-Ub-NS5-HA 1-900. 24hpt cells were treated with 100u/mL Type-I IFN. Reporter activity (measured by GFP signal) was visualized 48hpt by live microscopy. Results are representative of two independent experiments. B. Cells were transfected and IFN treated same as A. 48hpt, cells were lysed and CAT activity was measured. Fold induction of the ISGF3-FLAG transfected cells is calculated relative to the fold induction observed with ISRE-54-GFP-CAT transfected IFN treated cells versus untreated cells, both in the absence of over-expressed ISGF3 components. This value is set as 1 and symbolized by the dashed horizontal line. Data was obtained from one experiment performed in triplicate using independent sources for plasmids and cells. Bars indicate standard deviation of the samples. P values of the statistical differences calculated between each sample (using unpaired, one-tailed, Student’s T-test), are provided in the bottom panel. Those differences that were found to be significant (p-value ≤ 0.05) between two samples are signified by an asterisk. C) Western blot analysis of one representative experiment. Lanes 1 and 12 represent the control samples that do not over-express ISGF3 components or receive IFN treatment. Lanes 2 and 13 represent the control samples that do not over-express ISGF3 components and receive IFN treatment. Bands corresponding to the predicted molecular weights of NS5 1-900 and 10-900 are indicated by the upper arrow in the second panel. Bands corresponding to the predicted molecular weight of NS5 278-900 are indicated by the lower arrow of the second panel. Antibodies against FLAG, HA, GFP and GAPDH were used.
Fig. 4
Fig. 4
DENV is sensitive to mSTAT2 expression in an IFN dependent manner. A. 2FTGH, U6A, U6A (hSTAT2-FLAG) and U6A (mSTAT2-FLAG) were infected with DENV at an MOI of 0.1. 12hpi, cells were treated with 100u/mL of Type-I IFN. 36hpi, supernatant was collected and levels of virus were measured by titration in Vero cells. Percent inhibition is measured relative to the levels achieved in the same cell line not treated with IFN (see Material and Methods). No virus was detected at the zero hour time point. Data was obtained from three independent experiments and bars indicate standard deviation of the samples. ANOVA results (Bonferroni multiple comparison test) are presented on the lower panel. ns= no significance. ***= extremely significant (p-value <0.001). **= very significant (p-value 0.001–0.01). B. wtMEF’s, STAT2−/− MEF, STAT2−/− (hSTAT2-FLAG) and STAT2−/− (mSTAT2-FLAG) were infected with DENV at an MOI of 0.1 and processed same as in B. No virus was detected at the zero hour time point. Data was obtained from three independent experiments and bars indicate standard deviation of the samples. Statistical analysis same as A. See also Fig. S2.
Fig. 5
Fig. 5
mSTAT2 is required for control of DENV production in vivo and in mouse monocyte-derived macrophages. (A) WT and STAT2−/− mice were infected intravenously with 1 x 10⁶ pfu of mouse-adapted DENV2 DS210, 24 hours after an intra-peritoneal injection of enhancing anti-DENV1 antibodies. Lymph nodes were collected at 8, 18, 32 and 60 hours post-infection and viral load determined by qPCR for NS5. Results are from a single experiment (n=3 for each time point) and error bars indicate standard deviation. The P value for the effect of genotype was 0.0001. Limit of detection in this assay was 0.03 copies/mg represented by the dashed line. B) Same as A. Lymph nodes were collected at 8, 18, 32 and 60 hours post-infection and viral load determined by qPCR for NS5. Results are from a single experiment (n=3 for each time point) and error bars indicate standard deviation. The P value for the effect of genotype was 0.0001. Limit of detection in this assay was 0.03 copies/mg represented by the dashed line. (C) WT and STAT2−/− mice were infected intracranially with 2x10⁵ pfu of DS210. Brain tissue was collected at 24, 48 and 72 hours post-infection and viral load determined by plaque assay in BHK21 cells. The limit of detection was 0.05 PFU/mg. Results are from a single experiment (n=5 for 24hpi and 72hpi, n=6 for 48hpi) and error bars indicate standard deviation. The P value for the effect of genotype was 0.0001. D) Mouse bone marrow monocyte-derived macrophages (mBMDMs) from WT and STAT2−/− mice were infected with DENV2 16681 at an MOI of 1. Supernatant was removed at 0, 24 and 48hpi and virus titer was determined. Limit of detection in this assay is 4 Fluorescing Foci Units/mL (FFU/mL) represented by the dashed line. No virus was detected at the zero hour time point. Data was obtained from one infection performed in triplicate and bars indicate standard deviation of the samples. Statistically significant difference (p≤0.05) was determined using Student’s T-test (unpaired, one-tailed). ND= not detected.
Fig. 6
Fig. 6
Residues found within region 100 to 572 of hSTAT2 are required for NS5 mediated inhibition of STAT2 dependent transcription. A) 293T cells were co-transfected with plasmids encoding an ISRE-54-CAT-GFP reporter, pCAGGS-Firefly luciferase, the IRF9-hSTAT2-FLAG construct stated and either Empty, NS5-HA or Core-HA protein. 24hpt, cells were lysed and analyzed for CAT activity. Percent activation is calculated relative to samples transfected with ISRE-54-CAT-GFP, pCAGGS-Firefly luciferase and empty plasmid with no IRF9-hSTAT2-FLAG construct. Data was obtained from three independent experiments and error bars indicate standard deviation. B) Western blot of one representative experiment from the reporter assay. Lysates were analyzed by SDS-PAGE and immune-blot analysis using antibodies against FLAG, HA, GFP and Tubulin.
Fig. 7
Fig. 7
NS5 binding domain maps to the N-terminus of hSTAT2. A. U6A cells were co-transfected with NS5-HA and the FLAG tagged STAT2 constructs stated. The chimeras include N-terminal regions of hSTAT2 (1–181 and 1–301) in place of the mSTAT2 homologous region with the remainder of the downstream sequence derived from mSTAT2. 24hpt, cells were lysed and immune-precipitation performed against the FLAG epitope. Immune-precipitated samples were analyzed by SDS-PAGE and immune-blotting using antibodies against FLAG and HA in the top two panels and Tubulin in the bottom panel. Asterisks denote full length hSTAT2-FLAG which has a faster mobility in SDS-PAGE compared to the h/mSTAT2-FLAG chimeras. B. BHK21 cells were transfected with the stated FLAG-tagged STAT2, STAT1-GFP and NS5-HA-tagged constructs. 24hpt, cells were lysed and protein levels analyzed by SDS-PAGE and immune-blotting using antibodies against FLAG, GFP, HA and Tubulin. Upper arrow indicates expected mobility of mSTAT2-FLAG and chimeras and the lower arrow indicates expected mobility of hSTAT2-FLAG. C. BHK21 cells were transfected with the stated FLAG-tagged STAT2 or HA-tagged STAT2, STAT1-GFP and NS5-HA-tagged constructs. These chimeras include N-terminal regions of hSTAT2 (1–200, 1–210 and 1–250) in place of the mSTAT2 homologous region with the remainder of the downstream sequence derived from mSTAT2. In the case of m/h/mSTAT2-FLAG 181-301, the internal sequence of mSTAT2 has been replaced with the analogous sequence from hSTAT2. 24hpt, cells were lysed and protein levels analyzed by SDS-PAGE and immune-blotting using antibodies against FLAG, GFP, HA and Tubulin. E. BHK21 cells were co-transfected with NS5-HA and FLAG containing STAT constructs. The chimeras include N-terminal regions of hSTAT2 (1–124, 1–239 and 1–316) in place of the STAT1 homologous region with the remainder of the downstream sequence derived from STAT1. 24hpt, cells were lysed and immune-precipitation performed against the HA epitope. Immune-precipitated samples were analyzed by SDS-PAGE and immune-blotting using antibodies against FLAG, HA and Tubulin. F. U6A cells were transfected with the FLAG-tagged STAT2, STAT1-GFP and HA-tagged constructs. The chimeras include N-terminal regions of hSTAT2 (1–124, 1–239 and 1–316) in place of the STAT1 homologous region with the remainder of the downstream sequence derived from STAT1. 24hpt, cells were lysed and protein levels analyzed by SDS-PAGE and immune-blotting using antibodies against FLAG, GFP, HA and Tubulin. Upper arrow indicates expected mobility of hSTAT2-FLAG and lower arrows indicates expected mobility STAT1-FLAG and chimeras. All western blots are representative of experiments performed several times.

References

    1. Aebi M, Fah J, Hurt N, Samuel CE, Thomis D, Bazzigher L, Pavlovic J, Haller O, Staeheli P. cDNA structures and regulation of two interferon-induced human Mx proteins. Mol Cell Biol. 1989;9:5062–5072. - PMC - PubMed
    1. An J, Kimura-Kuroda J, Hirabayashi Y, Yasui K. Development of a novel mouse model for dengue virus infection. Virology. 1999;263:70–77. - PubMed
    1. Andrejeva J, Young DF, Goodbourn S, Randall RE. Degradation of STAT1 and STAT2 by the V proteins of simian virus 5 and human parainfluenza virus type 2, respectively: consequences for virus replication in the presence of alpha/beta and gamma interferons. J Virol. 2002;76:2159–2167. - PMC - PubMed
    1. Ashburn PM, Craig CF. Experimental investigations regarding the etiology of dengue fever. 1907. J Infect Dis. 2004;189:1747–1783. discussion 1744–1746. - PubMed
    1. Ashour J, Laurent-Rolle M, Shi PY, Garcia-Sastre A. NS5 of dengue virus mediates STAT2 binding and degradation. J Virol. 2009;83:5408–5418. - PMC - PubMed

Publication types

MeSH terms