. 2010 Nov 18;8(5):422-32.
doi: 10.1016/j.chom.2010.10.006.

Dengue virus-induced autophagy regulates lipid metabolism

Affiliations

Dengue virus-induced autophagy regulates lipid metabolism

Nicholas S Heaton et al. Cell Host Microbe. .

Abstract

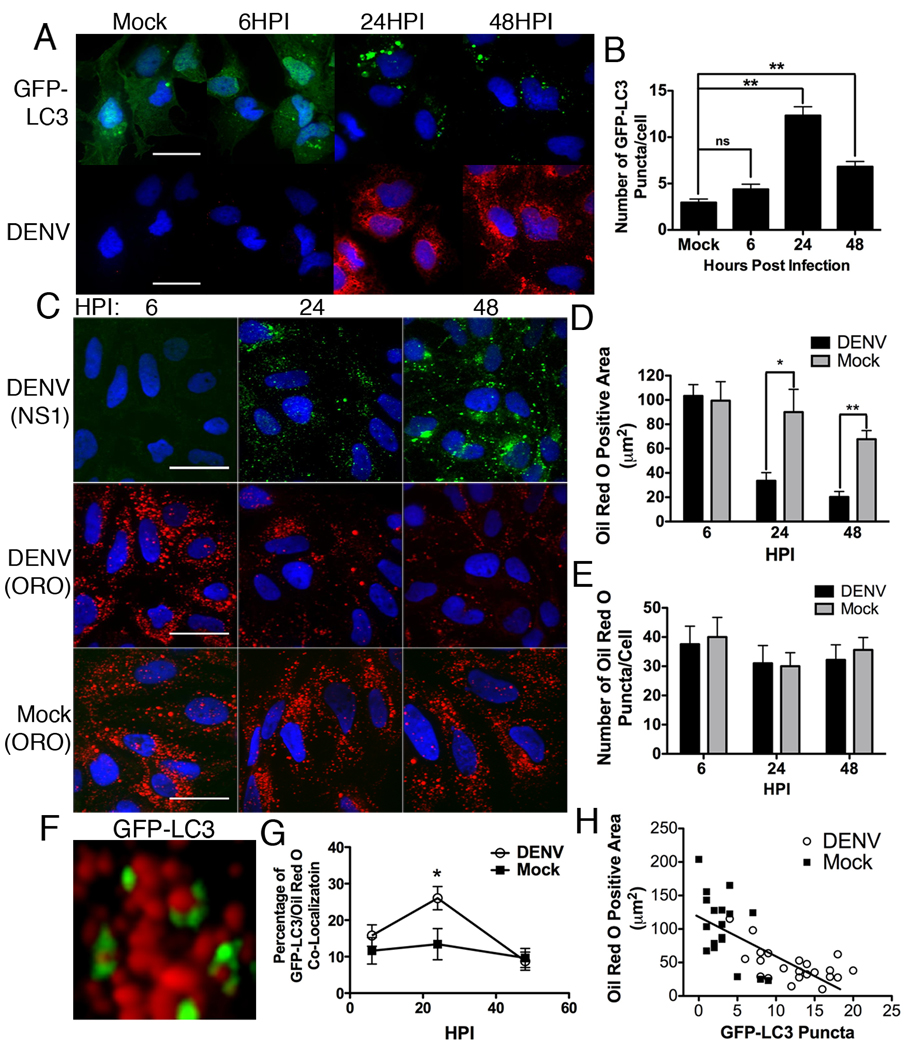
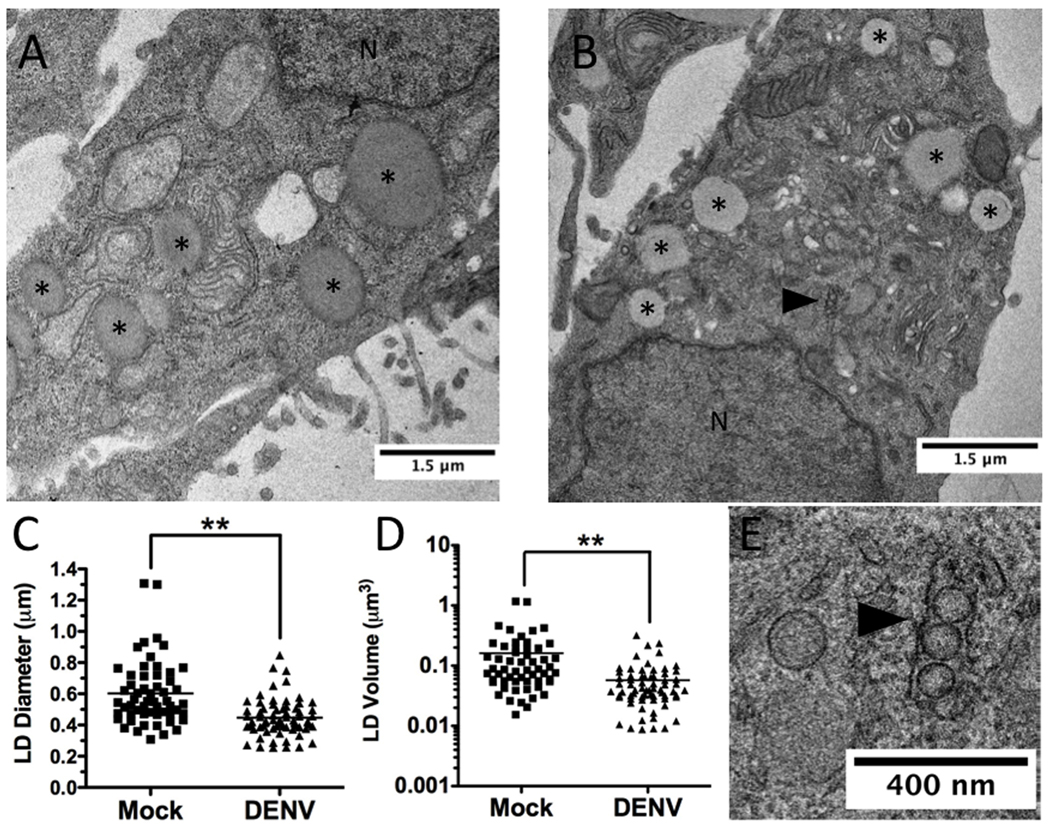
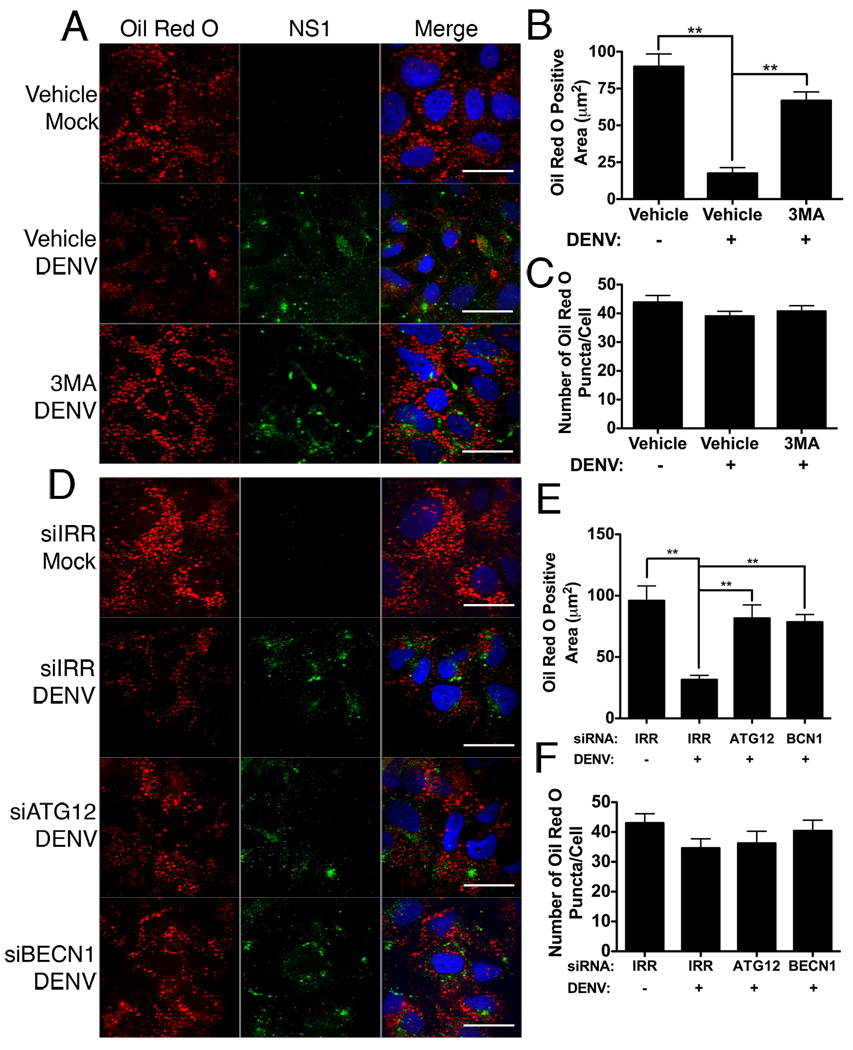
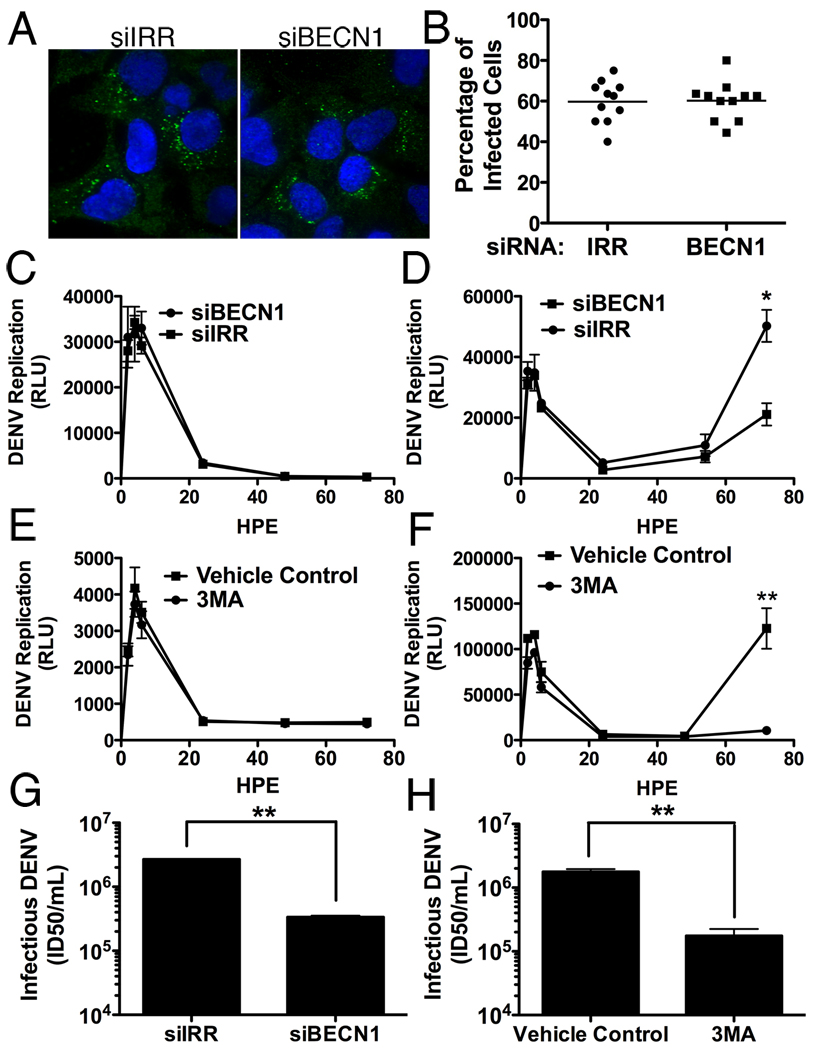
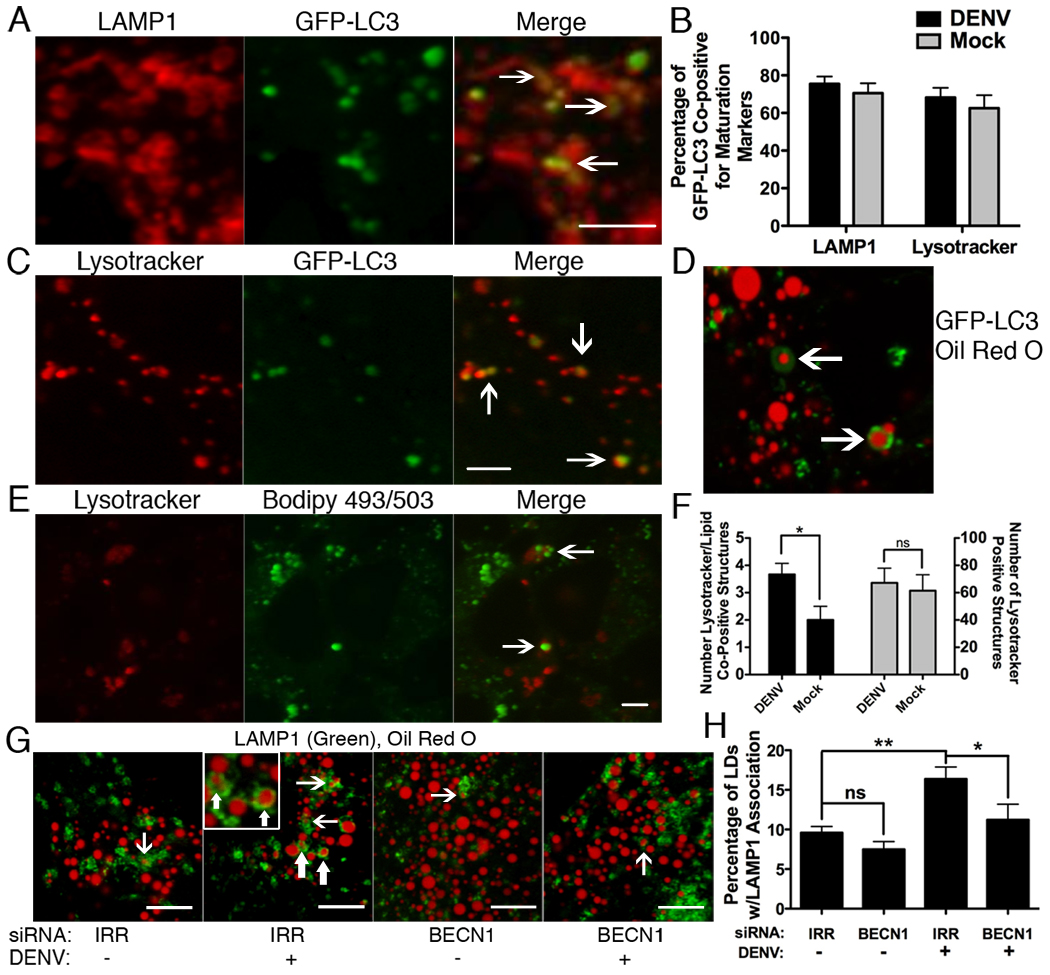
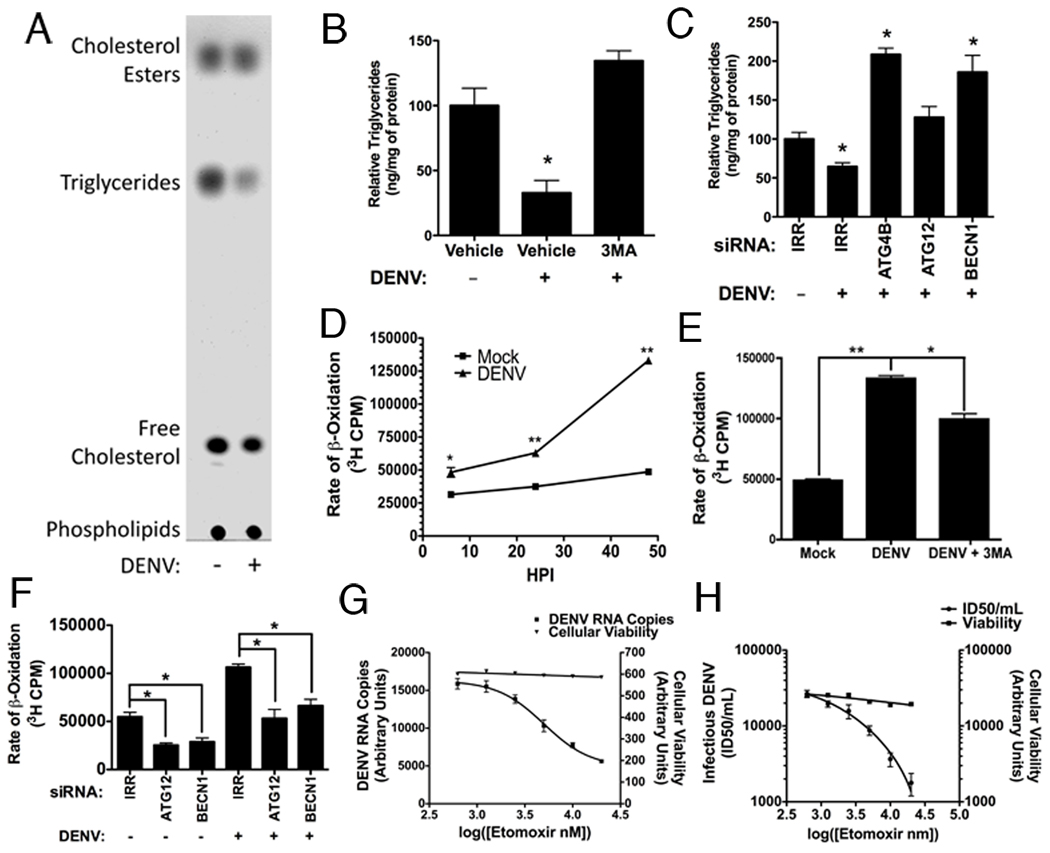
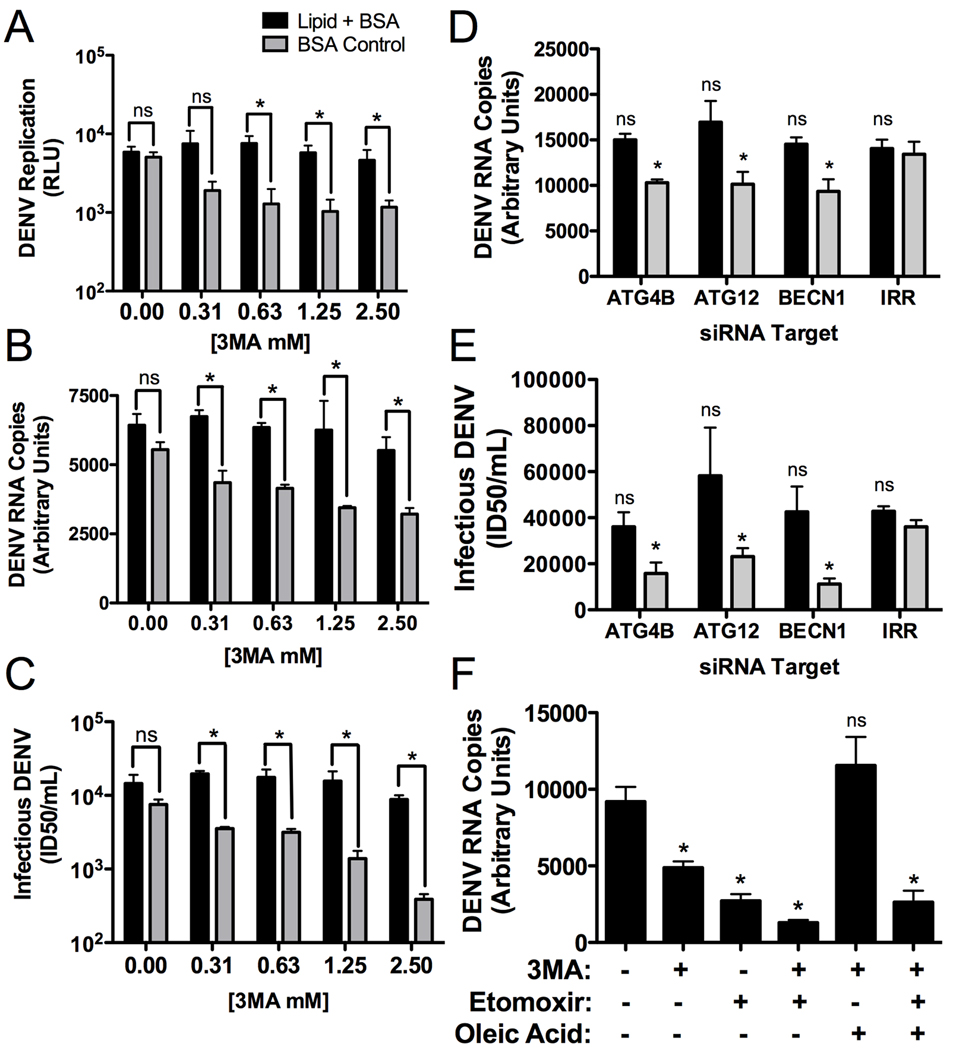
Autophagy influences numerous cellular processes, including innate and adaptive immunity against intracellular pathogens. However, some viruses, including dengue virus (DENV), usurp autophagy to enhance their replication. The mechanism for a positive role of autophagy in DENV infection is unclear. We present data that DENV induction of autophagy regulates cellular lipid metabolism. DENV infection leads to an autophagy-dependent processing of lipid droplets and triglycerides to release free fatty acids. This results in an increase in cellular β-oxidation, which generates ATP. These processes are required for efficient DENV replication. Importantly, exogenous fatty acids can supplant the requirement of autophagy in DENV replication. These results define a role for autophagy in DENV infection and provide a mechanism by which viruses can alter cellular lipid metabolism to promote their replication.


Figures

Figure 1
Figure 1. Lipid droplet area decreases as the number of GFP-LC3 puncta increase in DENV-infected cells
(A) Huh-7.5 cells were transfected with a GFP-LC3 construct, then DENV- or mock-infected at an MOI of 2 for the indicated times, fixed, and probed with specific monoclonal antibody D1-4G2-4-15. Nuclei were visualized by DAPI staining. Scale bar = 30µm. (B) ImageJ quantification of the number of GFP-LC3 puncta per cell in (A) **p<0.001. (C) Huh-7.5 cells were DENV- or mock-infected at an MOI of 2 for the indicated times and then stained with oil red O to visualize lipid droplets and antibodies to NS1 were used to verify cells were infected. Scale bar = 30µm. (D) Quantification of the total oil red O positive area per cell representative of three independent experiments. *p<0.05, **p<0.001. (E) Quantification of the number of oil red O puncta per cell. (F) Huh-7.5 cells were transfected with a GFP-LC3 construct and then DENV infected for, a high magnification image of GFP-LC3 association with lipid droplets is shown. (G) Huh7.5 cells were DENV- or mock-infected for the indicated times. The association of GFP-LC3 positive structures with oil red O are quantified, *p<0.05. (H) Scatter plot of the number of lipid droplets and GFP-LC3 puncta in individual DENV- or mock-infected cells from random fields of view, 36HPI. The trend-line indicates a statistically significant (p<0.05) linear regression showing a negative correlation between the two variables.
Figure 2
Figure 2. EM analysis of lipid droplet size during DENV infection
Huh-7.5 cells were DENV- or mock-infected (MOI=2) for 48 hours, fixed, and pelleted for EM staining and sectioning. Representative images of (A) mock- and (B) DENV-infected cells. *denotes lipid droplets, N denotes the nucleus, and the black arrowhead denotes DENV induced membrane structures. (B). Plot of the (C) average diameter and (D) calculated volume of lipid droplets (n>50) in EM images. **p<0.001. (E) High magnification image of B showing DENV induced membrane re-organization.
Figure 3
Figure 3. Inhibition of autophagy prevents depletion of lipid droplets in DENV-infected cells
(A) Huh-7.5 cells were mock- or DENV-infected at an MOI of 2 for two hours, then treated with 2.5mM 3MA or vehicle control. Cells were fixed 48HPI and stained with Oil Red O to visualize lipid droplets and an antibody against DENV NS1 (green). (C) Alternatively, Huh-7.5 cells were treated with siRNAs targeting an irrelevant HCV sequence (IRR), ATG12, or beclin1 (BECN1) for 24 hours, and then infected with DENV for 48 hours at an MOI of 2. Respective Image J quantification of total area staining positive for oil red O (B,E) and the total number of oil red O puncta per cell (C,F). Values represent the average of at least eight cells per treatment. **p≤0.001. Scale bar = 30µm.
Figure 4
Figure 4. DENV replication, but not entry or translation, is dependent upon autophagy
(A) Huh-7.5 cells silenced for BECN1 or an irrelevant control were infected (MOI=0.5) for 15hrs before fixation and staining for dsRNA and DAPI. Random fields of view were imaged (A) and quantified for the percentage of cells containing DENV-specific dsRNA. (B). A polymerase defective DENV-luciferase replicon was electropotated into Huh-7.5 cells silenced for BECN1 or treated with 3MA to measure input RNA translation (C and E respectively). In parallel, the wild-type replicon was introduced under the same conditions to determine the effect on viral RNA replication corresponding to time points after 24hrs (D and F). HPE is hours post electroporation. Autophagy was inhibited in Huh7.5 cells via siRNAs targeting BECN1 (G) or treatment with 3MA (H) and the release of infectious DENV was quantified. *p≤0.05, **p<0.001.
Figure 5
Figure 5. Increased delivery of lipids to acidified lysosomes in DENV-infected cells
Huh-7.5 cells were transfected with GFP-LC3, then DENV-infected at an MOI of 3–5 for 24 hours, then (A) fixed and probed with antibodies against LAMP1 or (C) stained with Lysotracker. (B) ImageJ quantitation of co-localization of GFP-LC3 with LAMP1 or Lysotracker. (D) GFP-LC3 transfected cells were DENV infected for 24 hours and the association of Oil Red O and GFP-LC3 was visualized. (E) Huh-7.5 cells were DENV infected (MOI=2) for 24 hours before treatment with Lysotracker and Bodipy 493/503 to stain lipid droplets. Arrows indicate examples of Lysotracker positive structures containing lipids and are quantified in (F). The numbers of in (F) are per field of view. (G) Huh-7.5 cells were treated with indicated siRNAs and maintained for 48 hours, then mock- or DENV-infected at an MOI=2 for 24 hours, then fixed and stained with oil red O and antibodies against LAMP1. Arrows depict examples of co-positive structures. (H) Image J quantitation of 10 randomly selected fields of view from part (E), *p<0.05, **p<0.001. Scale bars = 5µm.
Figure 6
Figure 6. DENV infection depletes triglycerides and increases β-oxidation in an autophagy-dependent manner
(A–C) DENV infection depletes triglyceride in an autophagy dependent manner. (A) DENV- or mock-infected cells (MOI=2) were harvested 48 HPI and total cellular lipids were extracted. Several major lipid classes were then resolved by TLC in a non-polar mobile phase. A representative TLC image (n=6) is shown. (B) Huh-7.5 cells were either mock-, DENV, or DENV+3MA-infected (MOI=2) for 48 hours. Cellular lipids were then extracted and the amount of triglycerides was quantified (n=3) relative to a protein loading control by colorimetric assay. *p≤0.05. (C) Huh-7.5 cells were maintained for 24 hours after introduction of irrelevant (IRR), ATG4B, ATG12 or BECN1 siRNAs, then mock- or DENV-infected (MOI=2) for 48 hours. Triglycerides were quantified as in (B). (D–G) DENV infection increases and requires β-oxidation in an autophagy-dependent manner. (D) Huh-7.5 cells were DENV- or mock-infected (MOI=2) for the indicated times, then pulsed for two hours with 3H palmitic acid to determine the rate of β-oxidation by measuring 3H2O (a byproduct of β-oxidation) via scintillation counting. (E) Huh-7.5 cells were either mock-, DENV, or DENV+3MA-infected (MOI=2) for 48 hours. β-oxidation was measured as in (D). (F) Huh-7.5 cells were transfected with the indicated siRNA (or irrelevant control) for 48 hours, then DENV infected for 32 hours. β-oxidation was measured as in (D). Huh-7.5 cells were DENV-infected for four hours, and then treated with the indicated concentrations of Etomoxir to inhibit β-oxidation. 24 hours post infection, (G) DENV RNA or (H) infectious DENV production was quantified. *p≤0.05, **p≤0.001
Figure 7
Figure 7. Defects in DENV replication caused by autophagy inhibition can be complimented by exogenous free fatty acids
(A) Huh-7.5 cells were electroporated with DENV luciferase reporter replicon RNAs. 24 hours post-electroporation, media was replaced with 3MA supplemented with oleic acid conjugated to BSA or BSA alone. 24 hours after addition of the drug, cells were lysed and the amount of DENV replication was assayed via luciferase assay. (B & C) Huh-7.5 cells were infected for four hours (MOI=0.5), then virus was removed and 3MA was applied at the indicated concentrations. The media was supplemented with an oleic acid-BSA conjugate or BSA alone. 48 hours post infection, (B) total RNA or (C) infectious DENV production was quantified. (D & E) Huh-7.5 cells were treated with the indicated siRNAs, maintained for 24 hours, then mock- or DENV-infected (MOI=2) for 24 hours, then (D) DENV RNA or (E) infectious DENV was quantified. (F). Huh-7.5 cells were infected for four hours (MOI=0.5), then virus was removed and the indicated inhibitors were applied. 24 hours after addition of the drug, DENV RNA was quantified. *p≤0.05.

References

    1. Andre P, Komurian-Pradel F, Deforges S, Perret M, Berland JL, Sodoyer M, Pol S, Brechot C, Paranhos-Baccala G, Lotteau V. Characterization of low- and very-low-density hepatitis C virus RNA-containing particles. J Virol. 2002;76:6919–6928. - PMC - PubMed
    1. Andre P, Perlemuter G, Budkowska A, Brechot C, Lotteau V. Hepatitis C virus particles and lipoprotein metabolism. Semin Liver Dis. 2005;25:93–104. - PubMed
    1. Berger KL, Cooper JD, Heaton NS, Yoon R, Oakland TE, Jordan TX, Mateu G, Grakoui A, Randall G. Roles for endocytic trafficking and phosphatidylinositol 4-kinase III alpha in hepatitis C virus replication. Proc Natl Acad Sci U S A. 2009;106:7577–7582. - PMC - PubMed
    1. Berger KL, Randall G. Potential roles for cellular cofactors in hepatitis C virus replication complex formation. Commun Integr Biol. 2009;2:471–473. - PMC - PubMed
    1. Blackham S, Baillie A, Al-Hababi F, Remlinger K, You S, Hamatake R, McGarvey MJ. Gene expression profiling indicates the roles of host oxidative stress, apoptosis, lipid metabolism, and intracellular transport genes in the replication of hepatitis C virus. J Virol. 2010;84:5404–5414. - PMC - PubMed

Publication types