. 2011 Jan;39(Database issue):D497-506.
doi: 10.1093/nar/gkq1115. Epub 2010 Nov 12.

AgBase: supporting functional modeling in agricultural organisms

Affiliations

AgBase: supporting functional modeling in agricultural organisms

Fiona M McCarthy et al. Nucleic Acids Res. 2011 Jan.

Abstract

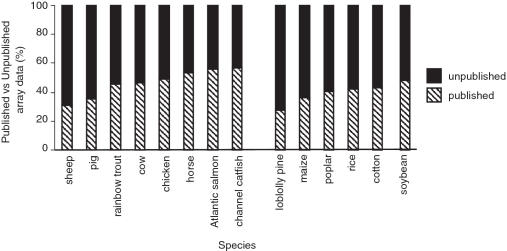
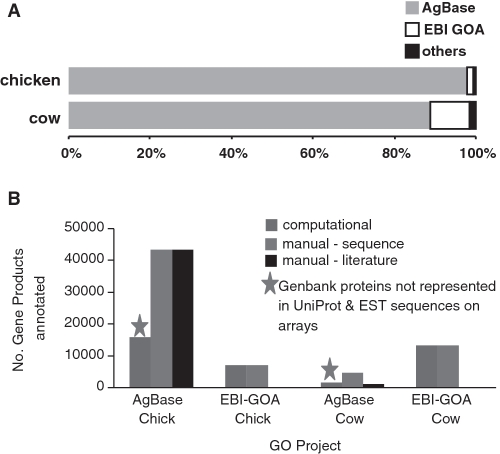
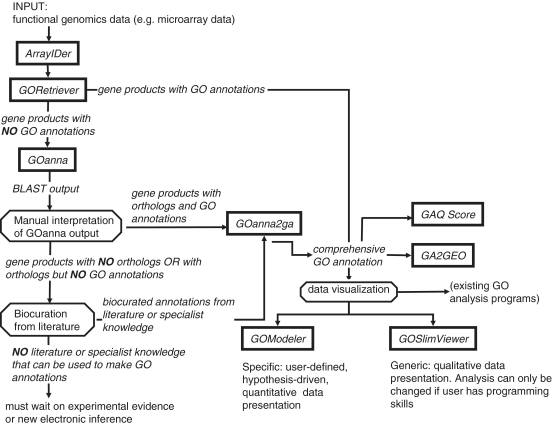
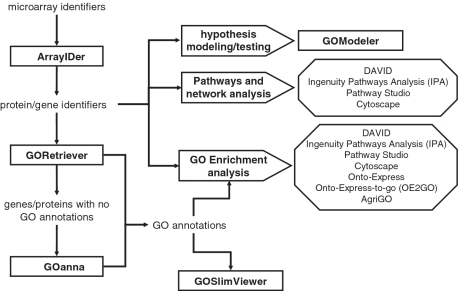
AgBase (http://www.agbase.msstate.edu/) provides resources to facilitate modeling of functional genomics data and structural and functional annotation of agriculturally important animal, plant, microbe and parasite genomes. The website is redesigned to improve accessibility and ease of use, including improved search capabilities. Expanded capabilities include new dedicated pages for horse, cat, dog, cotton, rice and soybean. We currently provide 590 240 Gene Ontology (GO) annotations to 105 454 gene products in 64 different species, including GO annotations linked to transcripts represented on agricultural microarrays. For many of these arrays, this provides the only functional annotation available. GO annotations are available for download and we provide comprehensive, species-specific GO annotation files for 18 different organisms. The tools available at AgBase have been expanded and several existing tools improved based upon user feedback. One of seven new tools available at AgBase, GOModeler, supports hypothesis testing from functional genomics data. We host several associated databases and provide genome browsers for three agricultural pathogens. Moreover, we provide comprehensive training resources (including worked examples and tutorials) via links to Educational Resources at the AgBase website.


Figures

Figure 1.
Figure 1.
Publication of agricultural microarray data. On average, less than half of the agricultural microarray data sets submitted to the NCBI GEO database are published. These statistics are based upon gene expression data submitted to the NCBI GEO database. Records are shown for as at 9 September 2010. For each species the number of expression data sets linked to a PubMed record was used to determine the proportion of unpublished data sets. Note that this approach is likely to under-estimate the amount of unpublished data sets as it does not include data not submitted to this database.
Figure 2.
Figure 2.
GO annotation strategies for AgBase and the EBI’s Gene Ontology Annotation (EBI GOA) group. Both AgBase and the EBI GOA Project provide GO annotations for chicken and cow. This annotation effort is complementary. (A) The percentage of biocuration for each group is shown for literature biocuration projects for chicken and cow. (B) Complementary biocuration of chicken and cow gene products. The EBI GOA Project provide computational GO annotation for UniProtKB records while the AgBase computational annotation effort focuses on Genbank gene products not represented in the UniProtKB database (typically these are gene products represented on commonly used arrays).
Figure 3.
Figure 3.
AgBase tools for functional analysis using the GO. This figure shows the individual AgBase tools for functional analysis of the GO and how they can be used sequentially as a pipeline to provide GO annotations and functional modeling for data sets. Square boxes represent AgBase tools; octagons represent manual steps or checks in the process.
Figure 4.
Figure 4.
Overview of functional modeling strategies. This figure shows how the AgBase tools can be used as part of a larger functional modeling strategy that incorporates other, existing functional analysis tools. Square boxes represent AgBase tools; arrow shaped boxes represent overall modeling approaches and octagonal boxes contain representative example of non-AgBase tools that are commonly used for functional modeling.

References

    1. McCarthy FM, Bridges SM, Wang N, Magee GB, Williams WP, Luthe DS, Burgess SC. AgBase: a unified resource for functional analysis in agriculture. Nucleic Acids Res. 2007;35:D599–D603. - PMC - PubMed
    1. Howe D, Costanzo M, Fey P, Gojobori T, Hannick L, Hide W, Hill DP, Kania R, Schaeffer M, St Pierre S, et al. Big data: the future of biocuration. Nature. 2008;455:47–50. - PMC - PubMed
    1. Barrett T, Edgar R. Gene expression omnibus: microarray data storage, submission, retrieval, and analysis. Methods Enzymol. 2006;411:352–369. - PMC - PubMed
    1. Sayers EW, Barrett T, Benson DA, Bolton E, Bryant SH, Canese K, Chetvernin V, Church DM, Dicuccio M, Federhen S, et al. Database resources of the National Center for Biotechnology Information. Nucleic Acids Res. 2010;38:D5–D16. - PMC - PubMed
    1. Bright LA, Burgess SC, Chowdhary B, Swiderski CE, McCarthy FM. Structural and functional-annotation of an equine whole genome oligoarray. BMC Bioinformatics. 2009;10(Suppl. 11):S8. - PMC - PubMed

Publication types