. 2011 Jan 21;286(3):1836-49.
doi: 10.1074/jbc.M110.151647. Epub 2010 Nov 12.

Inhibition of proprotein convertase SKI-1 blocks transcription of key extracellular matrix genes regulating osteoblastic mineralization

Affiliations

Inhibition of proprotein convertase SKI-1 blocks transcription of key extracellular matrix genes regulating osteoblastic mineralization

Jeff P Gorski et al. J Biol Chem. .

Abstract

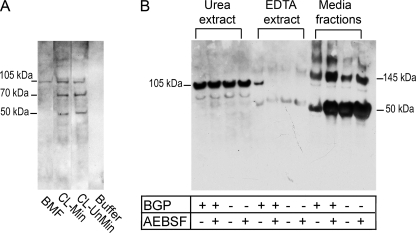
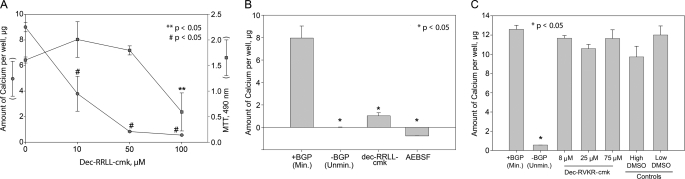
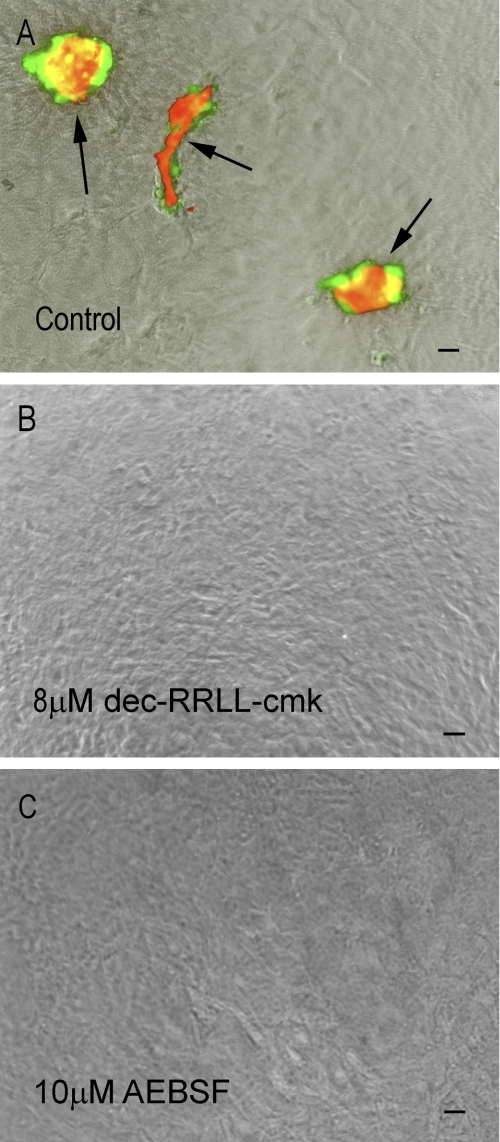
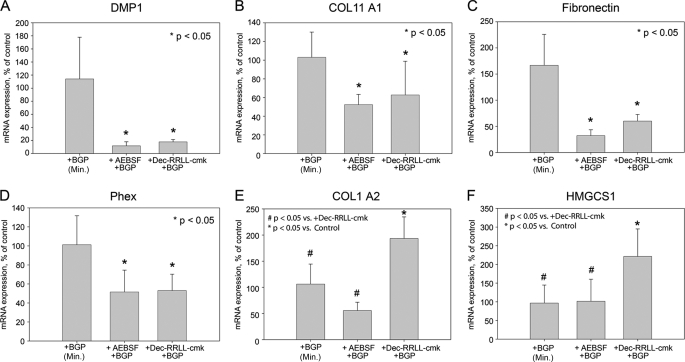
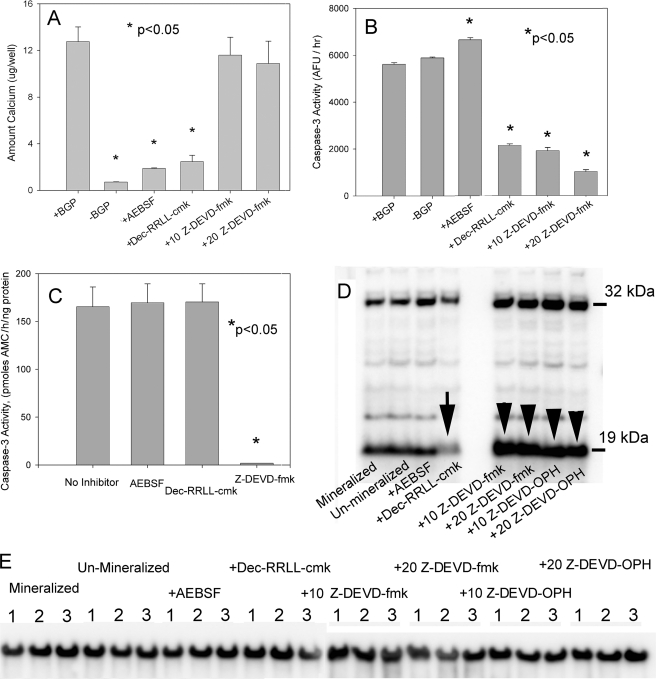
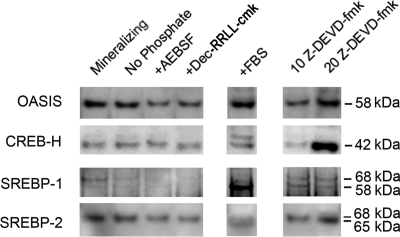
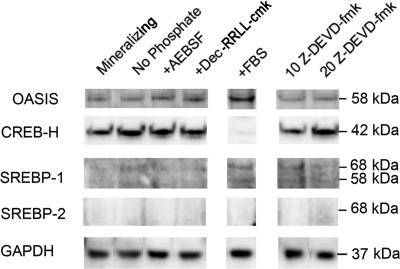
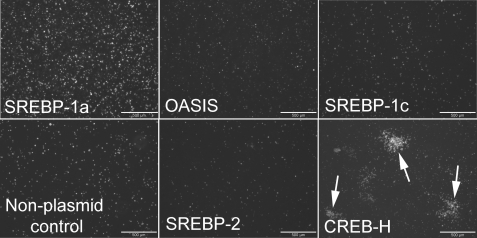
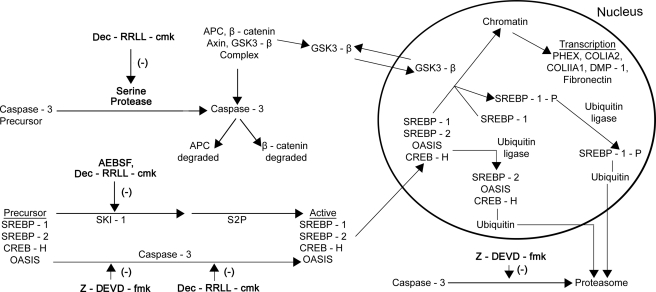
Mineralization, a characteristic phenotypic property of osteoblastic lineage cells, was blocked by 4-(2-aminoethyl) benzenesulfonyl fluoride hydrochloride (AEBSF) and decanoyl-Arg-Arg-Leu-Leu-chloromethyl ketone (dec-RRLL-cmk), inhibitors of SKI-1 (site 1; subtilisin kexin like-1) protease. Because SKI-1 is required for activation of SREBP and CREB (cAMP-response element-binding protein)/ATF family transcription factors, we tested the effect of these inhibitors on gene expression. AEBSF decreased expression of 140 genes by 1.5-3.0-fold including Phex, Dmp1, COL1A1, COL11A1, and fibronectin. Direct comparison of AEBSF and dec-RRLL-cmk, a more specific SKI-1 inhibitor, demonstrated that expression of Phex, Dmp1, COL11A1, and fibronectin was reduced by both, whereas COL1A2 and HMGCS1 were reduced only by AEBSF. AEBSF and dec-RRLL-cmk decreased the nuclear content of SKI-1-activated forms of transcription factors SREBP-1, SREBP-2, and OASIS. In contrast to AEBSF, the actions of dec-RRLL-cmk represent the sum of its direct actions on SKI-1 and indirect actions on caspase-3. Specifically, dec-RRLL-cmk reduced intracellular caspase-3 activity by blocking the formation of activated 19-kDa caspase-3. Conversely, overexpression of SKI-1-activated SREBP-1a and CREB-H in UMR106-01 osteoblastic cells increased the number of mineralized foci and altered their morphology to yield mineralization nodules, respectively. In summary, SKI-1 regulates the activation of transmembrane transcription factor precursors required for expression of key genes required for mineralization of osteoblastic cultures in vitro and bone formation in vivo. Our results indicate that the differentiated phenotype of osteoblastic cells and possibly osteocytes depends upon the non-apoptotic actions of SKI-1.


Figures

FIGURE 1.
FIGURE 1.
Activated 105-kDa SKI-1 is localized to extracellular calcified biomineralization foci in osteoblastic cultures. A, comparative Western blotting is shown of laser microdissected biomineralization foci with total cell layer extracts from osteoblastic cultures with anti-C-terminal SKI-1 antibodies. UMR106-01 osteoblastic cells were grown on glass slides and allowed to mineralize as described (13), and the resultant mineralized biomineralization foci were isolated by laser microdissection after staining with Alizarin red S dye. Isolated BMF and total cell layer fractions were then extracted and subjected to Western blotting as described previously (16). Six micrograms of protein were applied to each lane. No immunoreactive bands were detected in extraction buffer alone controls (Buffer, Fig. 1A). Numbers in the left margin refer to estimated molecular masses of immunoreactive bands. BMF, biomineralization foci isolated by laser micro dissection; CL-Min, total cell layer from mineralized culture; CL-UnMin, total cell layer from non-mineralized culture; Buffer, control for extraction buffer. B, shown is comparative Western blotting of cell layer extracts and media fractions from mineralized, AEBSF-inhibited, and non-mineralized osteoblastic cultures. Media were removed, and the residual cell layer fraction was then extracted sequentially with 0.05 m EDTA and with 8 m urea, 0.5% CHAPS as described by Huffman et al. (16). Equivalent amounts of each fraction (urea/CHAPS extract, EDTA extract, and media) were subjected to Western blotting with anti-C-terminal SKI-1 antibodies using chemiluminescent detection. Numbers in the left margin refer to estimated molecular masses of immunoreactive bands. BGP, with 6.5 mm β-glycerol phosphate; AEBSF, with 100 μm AEBSF.
FIGURE 2.
FIGURE 2.
SKI-1-specific inhibitor, dec-RRLL-cmk, like AEBSF, specifically inhibits mineralization in UMR106-01 osteoblastic cultures. Error bars refer to S.D.; probabilities were determined by a one-way analysis of variance with a Student-Newman-Keuls multiple comparison test. A, titration of dec-RRLL-cmk demonstrates its capacity to completely block mineralization without affecting cell viability. Osteoblastic cells were grown as usual and treated for 24 h under mineralizing conditions (see under “Experimental Procedures”) with different concentrations of inhibitor. Mineralization was assayed with a colorimetric calcium assay by reference to a standard curve; cell viability was determined using the MTT assay. B, side-by-side comparison reveals dec-RRLL-cmk and AEBSF both completely block mineralization in culture. +BGP, plus β-glycerol phosphate; −BGP, minus β-glycerol phosphate; dec-RRLL-cmk, 40 μg/ml inhibitor; AEBSF, 100 μm inhibitor. C, furin peptide inhibitor dec-RVKR-cmk is without effect on mineralization. +BGP, plus β-glycerol phosphate; −BGP, minus β-glycerol phosphate; dec-RVKR-cmk, range of concentrations from 8 to 75 μmol; DMSO, high and low represent solvent controls.
FIGURE 3.
FIGURE 3.
SKI-1 inhibitor dec-RRLL-cmk also blocks mineralization of primary mouse calvarial osteoblastic cells. Primary mouse calvarial cells from transgenic DMP1 GFP mice (34) were harvested by a conventional sequential collagenase digestion protocol and plated as noted under “Experimental Procedures.” The media was changed at 3-day intervals starting on day 3 after plating. Some cultures were treated with SKI-1 inhibitors. Scale bars = 375 μm. A, control calvarial cells produced mineralized nodules on day 12 after plating. Mineralized nodules were detected by fluorescence microscopy after staining the culture with 10 μg/ml Alizarin red S dye. The green fluorescent signal represents GFP protein expressed under control of the 10-kb Dmp1 promoter. Yellow represents areas of overlap of mineral (red) and GFP (green) signals. Arrows demark mineralized areas, which also express GFP protein. B, dec-RRLL-cmk blocks the mineralization of primary calvarial cells as well as expression of GFP protein. Cells were treated continuously from day 3 until day 12 with 8 μm dec-RRLL-cmk inhibitor, and then the cultures were imaged by fluorescence microscopy as in A. C, AEBSF inhibits the mineralization of primary calvarial cells as well as expression of GFP protein. Cells were treated continuously from day 3 until day 12 with 10 μm AEBSF inhibitor, and then the cultures were imaged by fluorescence microscopy as in A.
FIGURE 4.
FIGURE 4.
dec-RRLL-cmk and AEBSF block expression by UMR106-01 osteoblastic cells of key genes required for mineralization and for normal bone formation. Total RNA was isolated from replicate cultures (n = 6/condition) treated for 12 h with β-glycerol phosphate with or without inhibitors and converted into cDNA with reverse transcriptase (see “Experimental Procedures”). Quantitative PCR was carried out using primer sets for individual genes, and the relative expression for each gene was plotted as a percentage of that expressed by mineralized control cultures. Error bars refer to S.D., and probabilities were calculated using a one-way analysis of variance test. +BGP, control cultures treated with mineralizing conditions (6.5 mm β-glycerol phosphate); +AEBSF+BGP, cultures treated for 12 h with 100 μm AEBSF under mineralizing conditions; +dec-RRLL-cmk+BGP, cultures treated for 12 h with 40 μm dec-RRLL-cmk under mineralizing conditions. A–F, shown are quantitative PCR results for Dmp1, COL11A1, fibronectin, Phex, COL1A2, and HMGCS1 genes.
FIGURE 5.
FIGURE 5.
dec-RRLL-fmk partially blocks activation of caspase-3, although caspase-3 inhibitors do not inhibit osteoblast-mediated mineralization. UMR106-01 cultures were treated with β-glycerol phosphate with or without inhibitors, and then cell layer fractions were assayed for soluble caspase-3 activity, mineral calcium content, and caspase-3 protein content by Western blotting as described under “Experimental Procedures.” The direct effects of inhibitors on recombinant caspase-3 were analyzed separately. Error bars represent S.D., and probabilities were tested with a one-way analysis of variance test using a Student-Newman-Keuls multiple comparison test. Mineralized, cells treated with β-glycerol phosphate; Un-mineralized, no β-glycerol phosphate; +AEBSF, cells treated with 100 μm inhibitor and β-glycerol phosphate; +dec-RRLL-cmk, cells treated with 40–50 μm inhibitor and β-glycerol phosphate; +10 Z-DEVD-fmk, cells treated with 10 μm inhibitor and β-glycerol phosphate; +20 Z-DEVD-fmk, cells treated with 20 μm inhibitor and β-glycerol phosphate; +10 Z-DEVD-OPH, cells treated with 10 μm inhibitor and β-glycerol phosphate; +20 Z-DEVD-OPH, cells treated with 20 μm inhibitor and β-glycerol phosphate. All results are representative of at least duplicate experiments. A, treatment of UMR106-01 osteoblastic cultures with Z-DEVD-fmk does not block mineralization. The average amount of calcium deposited in biomineralization foci was then determined colorimetrically (n = 6). B, Z-DEVD-fmk and dec-RRLL-cmk led to significant reductions in intracellular caspase-3 activity. Soluble intracellular caspase-3 activity was extrapolated from kinetic reaction plots; the averaged data is plotted as arbitrary fluorescence units (AFU)/h (n = 6). C, dec-RRLL-cmk does not directly inactivate recombinant caspase-3. Activity was extrapolated from kinetic reaction plots and is plotted as the average nmol of amidomethylcoumarin (AMC) released/h/ng of protein (n = 6). D, shown is a Western blot analysis for precursor and activated caspase-3 forms. The amount of 32-kDa procaspase-3 and intracellular-activated 19-kDa caspase-3 subunit varies depending upon the protease inhibitor treatment. The total cell layer of treated UMR106-01 cultures was extracted with hot SDS/urea sample buffer and subjected to Western blotting with anti-caspase-3 antibodies. The pattern is representative of triplicate experiments. The arrow denotes the decreased 19-kDa band in dec-RRLL-cmk treated cells; arrowheads demark increased 19-kDa-band content in cells that were treated with caspase-3 Z-DEVD-fmk or Z-DEVD-OPH inhibitor. E, shown is a Western blot for intracellular GAPDH control. The cell layers in triplicate wells were extracted with hot SDS/urea sample buffer and subjected to Western blotting with anti-GADPH antibodies.
FIGURE 6.
FIGURE 6.
AEBSF, dec-RRLL-cmk, and Z-DEVD-fmk inhibitors alter the nuclear content of SKI-1-activated transcription factor(s). Cultures were treated for 12 h under mineralizing conditions with different protease inhibitors, and the nuclear fraction was then isolated. All culture conditions were carried out in triplicate, and Western blotting results for OASIS, CREB-H, SREBP-1, and SREBP-2 depicted are representative of these replicates. Cytoplasmic fractions were also isolated from these same cultures, and Western blots for control protein GAPDH are shown in Fig. 7. All lanes shown for each different transcription factor were imaged similarly and at the same time. Mineralizing, cells treated with mineralizing conditions (6.5 mm β-glycerol phosphate); No Phosphate, no β-glycerol phosphate added; +AEBSF, cells treated with 100 μm inhibitor; +dec-RRLL-cmk, cells treated with 40 μm dec-RRLL-cmk; 10 Z-DEVD-fmk, cells treated with 10 μm inhibitor; 20 Z-DEVD-fmk, cells treated with 20 μm inhibitor. OASIS panel, nuclear fractions subjected to Western blotting for OASIS are shown. CREB-H panel, nuclear fractions subjected to Western blotting for CREB-H are shown. SREBP-1 panel, nuclear fractions subjected to Western blotting for SREBP-1 are shown. SREBP-2 panel, nuclear fractions subjected to Western blotting for SREBP-2 are shown.
FIGURE 7.
FIGURE 7.
Cytoplasmic contents of selected SKI-1-activated transcription factors. Cultures were treated for 12 h under mineralizing conditions with different protease inhibitors, and then the cytoplasmic fraction was isolated from each using a commercial kit. All culture conditions were carried out in triplicate, results shown are representative of these replicates, and GAPDH Western blots were used to control for intraculture variations. Nuclear fractions were also isolated from these same cultures. All lanes shown on each panel below were imaged similarly and at the same time. Mineralizing, cells treated with 6.5 mm β-glycerol phosphate; No Phosphate, no β-glycerol phosphate added; +AEBSF, cells treated with 100 μm inhibitor; +dec-RRLL-cmk, cells treated with 40 μm dec-RRLL-cmk; 10 Z-DEVD-fmk, cells treated with 10 μm inhibitor; 20 Z-DEVD-fmk, cells treated with 20 μm inhibitor. OASIS panel, cytoplasmic fractions subjected to Western blotting for OASIS are shown. CREB-H panel, cytoplasmic fractions subjected to Western blotting for CREB-H are shown. SREBP-1 panel, cytoplasmic fractions subjected to Western blotting for SREBP-1 are shown. SREBP-2 panel, cytoplasmic fractions subjected to Western blotting for SREBP-2 are shown. GAPDH panel, cytoplasmic fractions subjected to Western blotting for GAPDH are shown.
FIGURE 8.
FIGURE 8.
Overexpression of activated forms of SREBP-1a and CREB-H in UMR106-01 cells increases the number and clustering of mineralized biomineralization foci, respectively. Forty hours after plating, cells were transiently transfected with plasmid in the presence of Metafectamine Pro and grown under standard mineralizing conditions (see “Experimental Procedures”). At 88 h, cultures were fixed with 70% ethanol, stained with Alizarin red S dye, and photographed using a fluorescence microscope. Mineralized BMF appear as white dots or clusters (arrows) under these conditions. Overexpression with activated OASIS, SREBP-1c, and SREBP-2 was without effect and indistinguishable from non-plasmid control cultures. Calcium assays revealed that SREBP-1a-transfected cells deposited 1.32-fold more hydroxyapatite than non-plasmid control cells (p < 0.05). Scale bar = 500 μm.
FIGURE 9.
FIGURE 9.
Proposed intracellular mechanism of AEBSF, dec-RRLL-cmk, and Z-DEVD-fmk effects on gene expression by osteoblastic cells. Steps depicted in bold type are those suggested from the experimental data presented here. Other parts of the model are derived from a variety of literature sources referenced under “Discussion.” GSK3, glycogen synthase kinase-3. APC, adenomatous polyposis coli protein.

Similar articles

Cited by

References

    1. Lian J. B., Stein G. S. (1992) Crit. Rev. Oral Biol. Med. 3, 269–305 - PubMed
    1. Ruchon A. F., Tenenhouse H. S., Marcinkiewicz M., Siegfried G., Aubin J. E., DesGroseillers L., Crine P., Boileau G. (2000) J. Bone Miner. Res. 15, 1440–1450 - PubMed
    1. The HYP Consortium (1995) Nat. Genet. 11, 130–136 - PubMed
    1. Lorenz-Depiereux B., Bastepe M., Benet-Pagès A., Amyere M., Wagenstaller J., Müller-Barth U., Badenhoop K., Kaiser S. M., Rittmaster R. S., Shlossberg A. H., Olivares J. L., Loris C., Ramos F. J., Glorieux F., Vikkula M., Jüppner H., Strom T. M. (2006) Nat. Genet. 38, 1248–1250 - PMC - PubMed
    1. Feng J. Q., Ward L. M., Liu S., Lu Y., Xie Y., Yuan B., Yu X., Rauch F., Davis S. I., Zhang S., Rios H., Drezner M. K., Quarles L. D., Bonewald L. F., White K. E. (2006) Nat. Genet. 38, 1310–1315 - PMC - PubMed

Publication types

MeSH terms