. 2011 Jan 28;286(4):2402-15.
doi: 10.1074/jbc.M110.180877. Epub 2010 Nov 12.

The polypeptide binding conformation of calreticulin facilitates its cell-surface expression under conditions of endoplasmic reticulum stress

Affiliations

The polypeptide binding conformation of calreticulin facilitates its cell-surface expression under conditions of endoplasmic reticulum stress

Elise Jeffery et al. J Biol Chem. .

Abstract

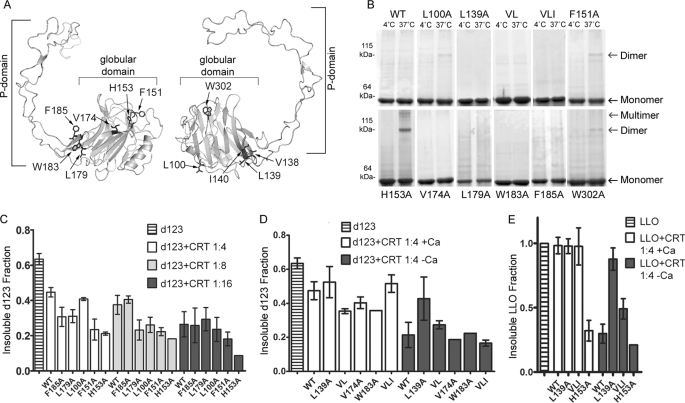
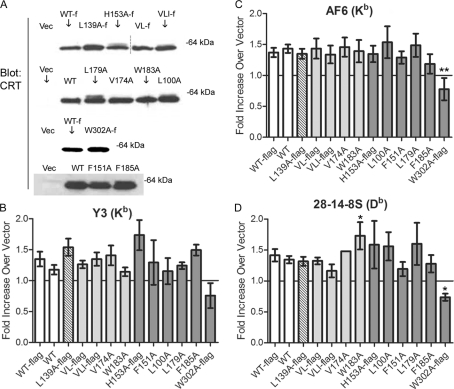
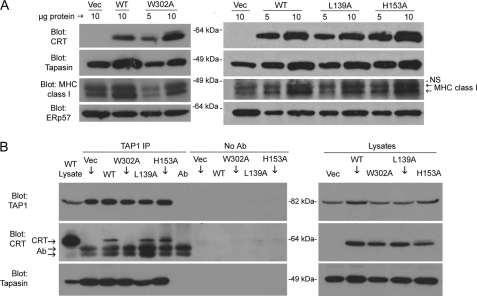
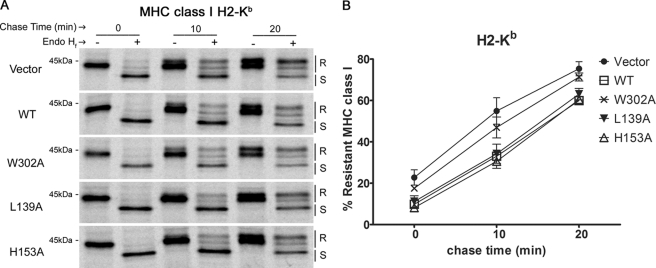
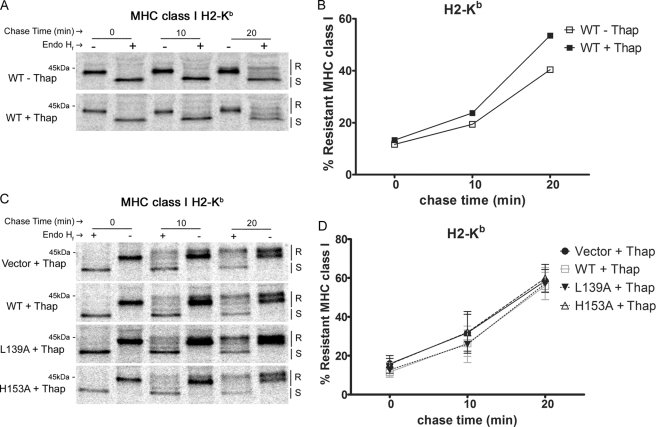
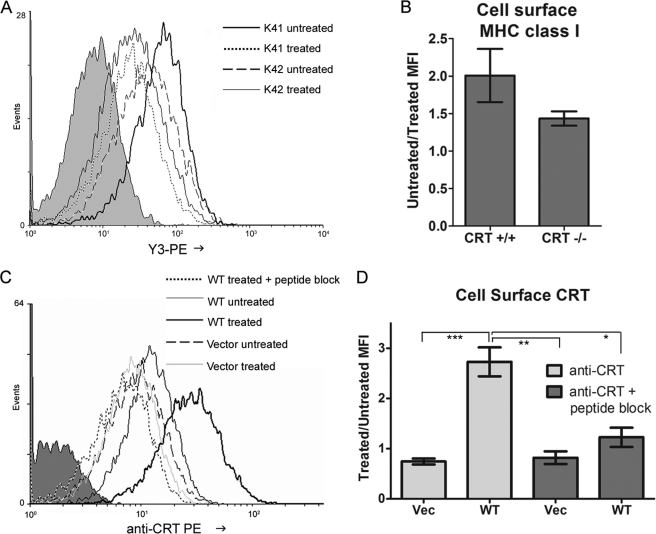
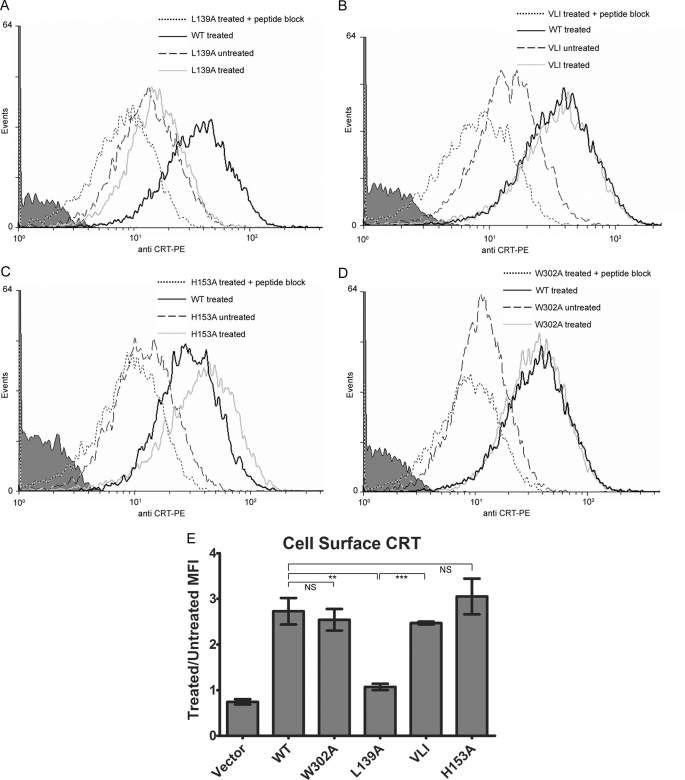
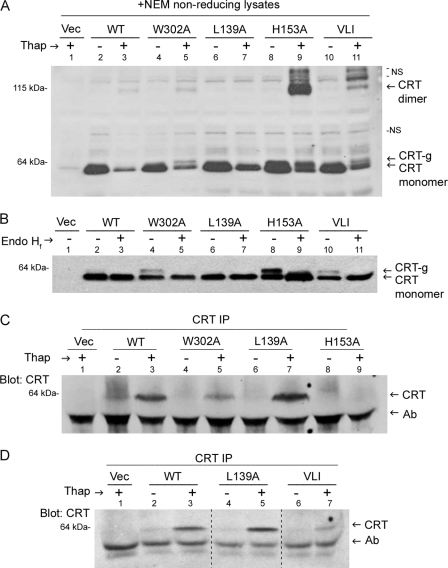
We define two classes of calreticulin mutants that retain glycan binding activity; those that display enhanced or reduced polypeptide-specific chaperone activity, due to conformational effects. Under normal conditions, neither set of mutants significantly impacts the ability of calreticulin to mediate assembly and trafficking of major histocompatibility complex class I molecules, which are calreticulin substrates. However, in cells treated with thapsigargin, which depletes endoplasmic reticulum calcium, major histocompatibility complex class I trafficking rates are accelerated coincident with calreticulin secretion, and detection of cell-surface calreticulin is dependent on its polypeptide binding conformations. Together, these findings identify a site on calreticulin that is an important determinant of the induction of its polypeptide binding conformation and demonstrate the relevance of the polypeptide binding conformations of calreticulin to endoplasmic reticulum stress-induced interactions.


Figures

FIGURE 1.
FIGURE 1.
Calreticulin conformations impact its in vitro chaperone activity. A, shown is a structural model for mCRT (34) derived from the crystal structure of its homolog calnexin (35). PyMOL Molecular Graphics System was used to render the structures. Two different views are shown that illustrate locations and identities of mutants characterized in this study. B, native PAGE gels of mCRT(WT) and mutants, after purifications of monomer peaks by gel filtration (supplemental Fig. S1, show representative gel filtration profiles for mutant protein purifications, with brackets indicating the fractions that were considered monomeric). Proteins (8 μm) were incubated for 1 h at 4 or 37 °C in buffer containing 0.5 mm Ca2+ followed by native-PAGE separation and Coomassie Blue staining. Data are representative of multiple experiments. C, quantifications of chaperone activities of calreticulin mutants toward the substrate LLO(d123) are shown. Substrate was incubated for 1 h at 37 °C in buffer containing in 0.5 mm Ca2+ in the absence or presence of wild type or mutant mCRT proteins. Tested molar ratios of LLO(d123):mCRT are indicated. LLO(d123) present in the pellet fraction was quantified as ratio relative to the total LLO(d123) present in pellet and supernatant fractions. Data for each mutant are the average of 2–3 independent experiments or from a single analysis (H153A at the 1:8 and 1:16 ratios). D, analyses were similar to C, with the difference that buffers contained either 0.5 mm Ca2+(+Ca) or 5 mm EDTA (−Ca). Data for each mutant are averaged from two-three independent experiments or represent a single analysis (W183A under both conditions and V174A in the −Ca condition). E, analyses were similar to D, with the difference that the substrate protein used was full-length LLO, and quantifications were done of each pellet fraction and expressed as a fraction of the pellet in the LLO alone condition. For each mutant, data are averaged from multiple independent experiments or from a single analysis (H153A in the −Ca condition). Representative gels for C-E are shown in supplemental Fig. S2.
FIGURE 2.
FIGURE 2.
mCRT mutants with induced or reduced chaperone activities are able to induce cell-surface expression of MHC class I molecules. A, cell lysates from K42 cells expressing each mCRT mutant or lacking mCRT expression (Vec) were separated by SDS-PAGE, and immunoblotting analyses were undertaken for detection of mCRT. B–D, shown are flow cytometric analyses of cell-surface expression of MHC class I on K42 cells infected with retroviruses encoding the indicated mCRT constructs or control virus lacking CRT. The -fold induction of mean fluorescence by each mCRT construct relative to parallel infections with control virus is indicated. Y3 (anti-H2-Kb), AF6 (anti-H2-Kb), or 28–14-8S (anti-H2-Db) antibodies were used in the analyses as indicated. Data are averaged over at least two independent analyses from separate infections that had similar levels of calreticulin expression for the mutant proteins as for mCRT(WT), except for V174A in (D), which was measured once. Shading is added for ease of interpretation and indicate degree of chaperone ability based on assays in Fig. 1, C–E. White represents wild type. Dark gray represents mutants that had strongly induced polypeptide-specific chaperone activity. Light gray represents mutants that had similar or slightly induced polypeptide-specific chaperone activity relative to wild type. The L139A mutant (hashed) is the only mutant that displayed reduced chaperone activity relative to wild type. * and ** indicate statistical difference from the appropriate WT control with p < 0.05 and p < 0.01, respectively. All p values were generated using a two-tailed, unpaired t test. W302A-FLAG is significantly different from WT-FLAG in C (p = 0.007) and D (p = 0.012) and shows the most statistical difference of all mutants from WT or WT-FLAG in B, with p = 0.074. W183A is significantly different from WT in D (p = 0.037) but not in B (p = 0.816) or C (p = 0.799). Neither H153A-FLAG nor L139A-FLAG was significantly different from WT-FLAG; in B, C, and D, respectively, p = 0.186, p = 0.892, p = 0.596 for H153A-FLAG versus WT-FLAG; p = 0.358, p = 0.860, p = 0.612 for L139A-FLAG versus WT-FLAG. Statistical analyses could not be performed on the single replicate of V174A in D. Surface MHC class I for WT, WT-FLAG, and L139A-FLAG-expressing cells are significantly different from vector (normalized to a value of 1 for each assay) when measured by all three antibodies (in B, C, and D, respectively, p = 0.039, p < 0.0001, p = 0.0001 for WT versus vector; p = 0.009, p = 0.0001, p = 0.0007 for WT-FLAG versus vector; p = 0.006, p = 0.004, p = 0.012, for L139A-FLAG versus vector). Dashed lines in panel A indicate lanes that were cut and pasted from the same blot to preserve the order of presentation of lanes. Some constructs contain a FLAG epitope tag inserted at the C terminus, before the KDEL retention sequence, and are indicated with “-f” or “-flag”.
FIGURE 3.
FIGURE 3.
mCRT mutants with induced or reduced chaperone activities can restore steady-state levels of tapasin and MHC class I heavy chains and become incorporated into the peptide loading complex. A, cell lysates from K42 cells expressing the indicated mCRT mutant or lacking mCRT expression (Vec) were separated by SDS-PAGE, and immunoblotting analyses were undertaken for detection of mCRT, tapasin, MHC class I heavy chain, and ERp57, as indicated. Steady-state levels of ERp57 were not reduced and may in fact be enhanced in calreticulin-deficient cells, with ERp57 blots thus serving as a loading control. The abilities of different calreticulin mutants to restore steady-state levels of MHC class I and tapasin were verified from at least two separate infections. Only mCRT(W302A) was impaired in its ability to rescue heavy chain and tapasin expression. MHC class I is occasionally observed as a doublet (indicated by arrows). NS indicates a nonspecific band. B, immunoprecipitations (IP) with anti-TAP1 of lysates from cells expressing the indicated mCRT constructs or control vector-infected (Vec) cells. Immunoblotting analyses were undertaken with antibodies directed against various PLC components. Data are representative of three independent analyses. No antibody (No Ab) controls were performed by incubating indicated lysates with beads in the absence of antibody, and the Ab lane in the TAP1 IP group indicates an IP control with buffer. Ab marks the position of the antibody heavy chain band. The left-most lane (WT lysate) marks the migration position of each immunoblotted protein (from cell lysates).
FIGURE 4.
FIGURE 4.
mCRT mutants with induced or reduced chaperone activity can reduce the kinetics of MHC class I export from the ER. A, K42 cells expressing mCRT(WT), the indicated mutants, or no calreticulin (Vector) were metabolically labeled for 10 min and chased for indicated times. Proteins in lysates were immunoprecipitated with Y3 (anti H2-Kb) antibody, then digested with Endo Hf (+ lanes) or left undigested (− lanes) and analyzed by SDS-PAGE and phosphorimaging analyses. R and S indicate Endo Hf digestion-resistant and -sensitive bands, respectively. B, Endo Hf-resistant MHC class I heavy chain (HC) bands in the gels from A were quantified using ImageQuant and plotted as a percentage of total HC. Data in B are averaged from two-three independent analyses.
FIGURE 5.
FIGURE 5.
In thapsigargin-treated cells, calreticulin is unable to reduce the kinetics of MHC class I export from the ER. A and C, K42 cells expressing mCRT(WT), the indicated mutants, or no calreticulin (Vec) were metabolically labeled for 10 min and chased for indicated times. Proteins in lysates were immunoprecipitated with Y3 (anti H2-Kb) antibody, then digested with Endo Hf (+ lanes) or left undigested (− lanes) and analyzed by SDS-PAGE and phosphorimaging analyses. Cells were untreated (− Thap) or treated with thapsigargin (+ Thap) as indicated. R and S indicate Endo Hf digestion-resistant and -sensitive bands, respectively. B and D, Endo Hf-resistant MHC class I heavy chain bands in the gels from A and C were quantified using ImageQuant and plotted as a percentage of total heavy chain. Data in B are based on a single analysis, and data in D are averaged from three independent experiments.
FIGURE 6.
FIGURE 6.
Thapsigargin treatment reduces cell-surface MHC class I and induces cell-surface calreticulin expression. A and B, representative flow cytometric analyses show staining of cell-surface MHC class I with the mouse MHC class I (H2-Kb-specific) antibody Y3 in thapsigargin-treated cells compared with untreated cells using K41 (CRT +/+) or K42 (CRT/−) cells. Data shown in B are averaged over three independent experiments. PE, R-Phycoerythrin. C and D, representative flow cytometric analyses show cell-surface calreticulin induction by thapsigargin treatment. K42 cells infected with retroviruses encoding mCRT(WT) (WT) or control virus (Vector/Vec) were used. Shaded histograms indicate cells stained only with secondary antibody. Detection of cell-surface CRT is inhibited by preincubating the antibody with its peptide immunogen (peptide block). Data in D are averaged over three-four experiments. MFI indicates mean fluorescence intensity. * indicates p < 0.05; ** indicates p < 0.01. *** indicates p < 0.001. All p values were generated using a two-tailed, unpaired t test.
FIGURE 7.
FIGURE 7.
Polypeptide-based interactions contribute to calreticulin binding to the cell surface of ER calcium-depleted fibroblasts. A–D, representative histograms show thapsigargin-induced cell-surface calreticulin in K42 cells expressing mCRT(WT) or indicated mutants. Analyses were performed as described in Fig. 6C. E, results are averaged across two-four independent analyses for each mutant. MFI indicates mean fluorescence intensity. NS indicates not significant. ** indicates p < 0.01. *** indicates p < 0.001. All p values were generated using a two-tailed, unpaired t test. PE, R-Phycoerythrin.
FIGURE 8.
FIGURE 8.
Calreticulin conformations impact its secretion from thapsigargin-treated cells. A, immunoblotting analysis of 20 mm N-ethylmaleimide (NEM) lysates from K42 cells expressing indicated mCRT constructs or control cells lacking calreticulin (Vec). Untreated cells (−) or cells treated for 5 h with 5 μm thapsigargin (Thap, +) were analyzed under non-reducing (−DTT) conditions. Results are representative of two independent analyses. NS denotes nonspecific bands. B, reducing lysates from indicated thapsigargin-treated cells were left undigested (−) or digested with endoglycosidase Hf (+). Results are representative of two independent analyses. C and D, shown is an immunoblotting analysis for detection of mCRT in an anti-calreticulin-based immunoprecipitation (IP) of supernatants from the indicated untreated cells (−) or cells treated with 5 μm thapsigargin for 5 h (+). K42 cells lacking calreticulin (Vec) or cells expressing mCRT(WT) or the indicated mutants were used. Results are representative of two-four independent analyses. Ab denotes migration position of antibody heavy chain band. Dashed lines in panel D indicate lanes that were cut and pasted from the same blot to preserve the order of presentation of lanes.

Similar articles

Cited by

References

    1. Ellgaard L., Helenius A. (2003) Nat. Rev. Mol. Cell Biol. 4, 181–191 - PubMed
    1. Saito Y., Ihara Y., Leach M. R., Cohen-Doyle M. F., Williams D. B. (1999) EMBO J. 18, 6718–6729 - PMC - PubMed
    1. Rizvi S. M., Mancino L., Thammavongsa V., Cantley R. L., Raghavan M. (2004) Mol. Cell 15, 913–923 - PubMed
    1. Gao B., Adhikari R., Howarth M., Nakamura K., Gold M. C., Hill A. B., Knee R., Michalak M., Elliott T. (2002) Immunity 16, 99–109 - PubMed
    1. Raghavan M., Del Cid N., Rizvi S. M., Peters L. R. (2008) Trends Immunol. 29, 436–443 - PMC - PubMed

Publication types

MeSH terms