MASCP Gator: an aggregation portal for the visualization of Arabidopsis proteomics data
- PMID: 21075962
- PMCID: PMC3075751
- DOI: 10.1104/pp.110.168195
MASCP Gator: an aggregation portal for the visualization of Arabidopsis proteomics data
Abstract
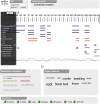
Proteomics has become a critical tool in the functional understanding of plant processes at the molecular level. Proteomics-based studies have also contributed to the ever-expanding array of data in modern biology, with many generating Web portals and online resources that contain incrementally expanding and updated information. Many of these resources reflect specialist research areas with significant and novel information that is not currently captured by centralized repositories. The Arabidopsis (Arabidopsis thaliana) community is well served by a number of online proteomics resources that hold an abundance of functional information. These sites can be difficult to locate among a multitude of online resources. Furthermore, they can be difficult to navigate in order to identify specific features of interest without significant technical knowledge. Recently, members of the Arabidopsis proteomics community involved in developing many of these resources decided to develop a summary aggregation portal that is capable of retrieving proteomics data from a series of online resources on the fly. The Web portal is known as the MASCP Gator and can be accessed at the following address: http://gator.masc-proteomics.org/. Significantly, proteomics data displayed at this site retrieve information from the data repositories upon each request. This means that information is always up to date and displays the latest data sets. The site also provides hyperlinks back to the source information hosted at each of the curated databases to facilitate more in-depth analysis of the primary data.
Figures


References
-
- Alexandersson E, Saalbach G, Larsson C, Kjellbom P. (2004) Arabidopsis plasma membrane proteomics identifies components of transport, signal transduction and membrane trafficking. Plant Cell Physiol 45: 1543–1556 - PubMed
-
- Baerenfaller K, Grossmann J, Grobei MA, Hull R, Hirsch-Hoffmann M, Yalovsky S, Zimmermann P, Grossniklaus U, Gruissem W, Baginsky S. (2008) Genome-scale proteomics reveals Arabidopsis thaliana gene models and proteome dynamics. Science 320: 938–941 - PubMed
-
- Bayer EM, Bottrill AR, Walshaw J, Vigouroux M, Naldrett MJ, Thomas CL, Maule AJ. (2006) Arabidopsis cell wall proteome defined using multidimensional protein identification technology. Proteomics 6: 301–311 - PubMed
-
- Benschop JJ, Mohammed S, O’Flaherty M, Heck AJ, Slijper M, Menke FL. (2007) Quantitative phosphoproteomics of early elicitor signaling in Arabidopsis. Mol Cell Proteomics 6: 1198–1214 - PubMed

