. 2011 Jan;10(1):110-7.
doi: 10.1128/EC.00185-10. Epub 2010 Nov 12.

The N-terminal domain of the Flo1 flocculation protein from Saccharomyces cerevisiae binds specifically to mannose carbohydrates

Affiliations

The N-terminal domain of the Flo1 flocculation protein from Saccharomyces cerevisiae binds specifically to mannose carbohydrates

Katty V Y Goossens et al. Eukaryot Cell. 2011 Jan.

Abstract

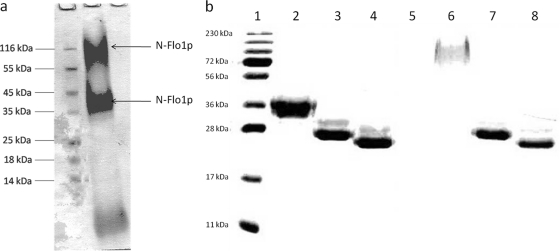
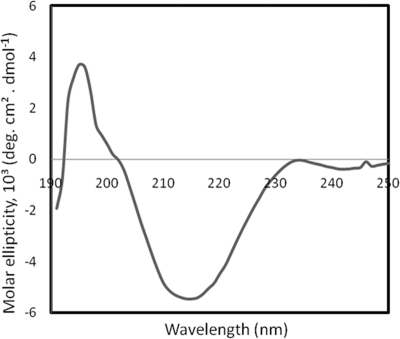
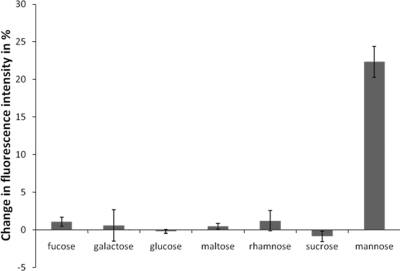
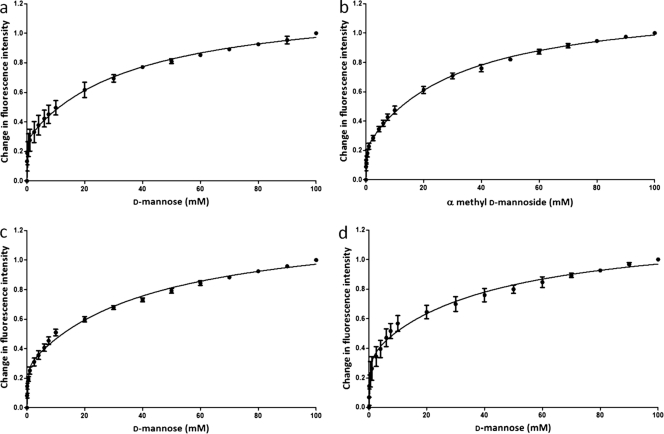
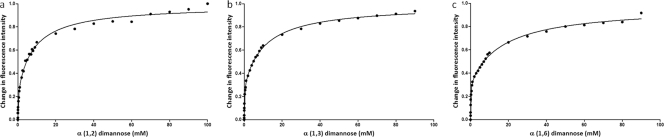
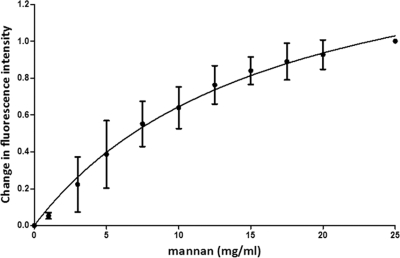
Saccharomyces cerevisiae cells possess a remarkable capacity to adhere to other yeast cells, which is called flocculation. Flocculation is defined as the phenomenon wherein yeast cells adhere in clumps and sediment rapidly from the medium in which they are suspended. These cell-cell interactions are mediated by a class of specific cell wall proteins, called flocculins, that stick out of the cell walls of flocculent cells. The N-terminal part of the three-domain protein is responsible for carbohydrate binding. We studied the N-terminal domain of the Flo1 protein (N-Flo1p), which is the most important flocculin responsible for flocculation of yeast cells. It was shown that this domain is both O and N glycosylated and is structurally composed mainly of β-sheets. The binding of N-Flo1p to D-mannose, α-methyl-D-mannoside, various dimannoses, and mannan confirmed that the N-terminal domain of Flo1p is indeed responsible for the sugar-binding activity of the protein. Moreover, fluorescence spectroscopy data suggest that N-Flo1p contains two mannose carbohydrate binding sites with different affinities. The carbohydrate dissociation constants show that the affinity of N-Flo1p for mono- and dimannoses is in the millimolar range for the binding site with low affinity and in the micromolar range for the binding site with high affinity. The high-affinity binding site has a higher affinity for low-molecular-weight (low-MW) mannose carbohydrates and no affinity for mannan. However, mannan as well as low-MW mannose carbohydrates can bind to the low-affinity binding site. These results extend the cellular flocculation model on the molecular level.


Figures

Fig. 1.
Fig. 1.
(a) SDS-PAGE of eluted proteins after affinity chromatography using a Ni column. The Coomassie blue-stained gel shows that three protein bands with different molecular masses were purified. Mass spectroscopy revealed that the upper two bands correspond to N-Flo1p, as indicated with arrows. N-Flo1p appears in two different populations, distinguished by their molecular masses. Lane 1, molecular mass marker; lane 2, eluted fraction from Ni column. (b) SDS-PAGE of the two N-Flo1p populations, successively not deglycosylated, N-deglycosylated, and N- and O-deglycosylated. The gel was stained with Coomassie blue. Lane 1, molecular mass marker; lanes 2 and 6, N-Flo1p populations of lower and higher molecular masses, respectively, before enzymatic treatment; lanes 3 and 7, N-Flo1p populations of lower and higher molecular masses, respectively, after endo H treatment; lanes 4 and 8, N-Flo1p populations of lower and higher molecular masses, respectively, after treatment with both endo H and α-mannosidase.
Fig. 2.
Fig. 2.
Far-UV circular dichroism spectrum of N-Flo1p.
Fig. 3.
Fig. 3.
Quenching of N-Flo1p by different carbohydrates, each at a concentration of 100 mM, displayed as the decrease in the intensity of the fluorescence signal at 350 nm.
Fig. 4.
Fig. 4.
Titration curves of N-Flo1p with increasing concentrations of carbohydrate, ranging from 50 μM to 100 mM. The spheres show the change in fluorescence intensity at each concentration of carbohydrate, and the full lines show the fitting of the data according to the binding model. (a) Glycosylated N-Flo1p was titrated with increasing concentrations of d-mannose. KD, Ha was determined to be 57.77 ± 18.82 μM, and KD, La was determined to be 36.69 ± 6.27 mM. (b) Glycosylated N-Flo1p was titrated with increasing concentrations of α-methyl-d-mannoside. KD, Ha was determined to be 80.56 ± 23.79 μM, and KD, La was determined to be 31.86 ± 3.52 mM. (c) N-deglycosylated N-Flo1p was titrated with increasing concentrations of d-mannose. KD, Ha was determined to be 145.90 ± 37.29 μM, and KD, La was determined to be 43.29 ± 6.55 mM. (d) N- and O-deglycosylated N-Flo1p was titrated with increasing concentrations of d-mannose. KD, Ha was determined to be 283.60 ± 96.85 μM, and KD, La was determined to be 42.49 ± 12.00 mM.
Fig. 5.
Fig. 5.
Titration curves for glycosylated N-Flo1p with increasing concentrations of dimannoses. The spheres show the change in fluorescence intensity at each concentration of dimannose, ranging from 10 μM to 100 mM for α(1,2)-dimannose and from 10 μM to 90 mM for α(1,3)-dimannose and α(1,6)-dimannose. Determination of the KD values was performed by fitting (full line) the experimental data points with the binding model. (a) KD, Ha = 205.70 μM and KD, La = 8.47 mM for α(1,2)-dimannose. (b) KD, Ha = 149.50 μM and KD, La = 10.99 mM for α(1,3)-dimannose. (c) KD, Ha = 148.20 μM and KD, La = 17.55 mM for α(1,6)-dimannose.
Fig. 6.
Fig. 6.
Titration curve for N-Flo1p with increasing concentrations of mannan. The circles show the change in fluorescence intensity at each concentration of mannan, ranging from 1 mg/ml to 25 mg/ml. The full line shows the fitting of the data according to the binding model. KD was determined to be 16.53 ± 3.74 mg/ml.

Similar articles

Cited by

References

    1. Andrade M. A., Chacon P., Merelo J. J., Moran F. 1993. Evaluation of secondary structure of proteins from UV circular dichroism spectra using an unsupervised learning neural network. Protein Eng. 6:383–390 - PubMed
    1. Benoit R. M., Wilhelm R. N., Scherer-Becker D., Ostermeier C. 2006. An improved method for fast, robust, and seamless integration of DNA fragments into multiple plasmids. Protein Expr. Purif. 45:66–71 - PubMed
    1. Bony M., Thines-Sempoux D., Barre P., Blondin B. 1997. Localization and cell surface anchoring of the Saccharomyces cerevisiae flocculation protein Flo1p. J. Bacteriol. 179:4929–4936 - PMC - PubMed
    1. Caro L. H., et al. 1997. In silico identification of glycosyl-phosphatidylinositol-anchored plasma-membrane and cell wall proteins of Saccharomyces cerevisiae. Yeast 13:1477–1489 - PubMed
    1. Dean N. 1999. Asparagine-linked glycosylation in the yeast Golgi. Biochim. Biophys. Acta 1426:309–322 - PubMed

Publication types

MeSH terms

LinkOut - more resources