

Flexible mechanisms underlie the evaluation of visual confidence
- PMID: 21076036
- PMCID: PMC2996459
- DOI: 10.1073/pnas.1007704107
Flexible mechanisms underlie the evaluation of visual confidence
Abstract
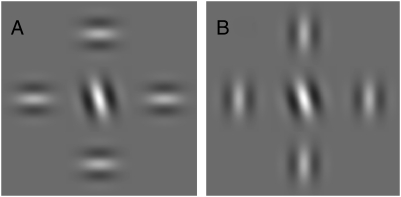
Visual processing is fraught with uncertainty: The visual system must attempt to estimate physical properties despite missing information and noisy mechanisms. Sometimes high visual uncertainty translates into lack of confidence in our visual perception: We are aware of not seeing well. The mechanism by which we achieve this awareness--how we assess our own visual uncertainty--is unknown, but its investigation is critical to our understanding of visual decision mechanisms. The simplest possibility is that the visual system relies on cues to uncertainty, stimulus features usually associated with visual uncertainty, like blurriness. Probabilistic models of the brain suggest a more sophisticated mechanism, in which visual uncertainty is explicitly represented as probability distributions. In two separate experiments, observers performed a visual discrimination task in which confidence could be determined by the cues available (contrast and crowding or eccentricity and masking) or by their actual performance, the latter requiring a more sophisticated mechanism than cue monitoring. Results show that observers' confidence followed performance rather than cues, indicating that the mechanisms underlying the evaluation of visual confidence are relatively complex. This result supports probabilistic models, which imply the existence of sophisticated mechanisms for evaluating uncertainty.
Conflict of interest statement
The authors declare no conflict of interest.
Figures
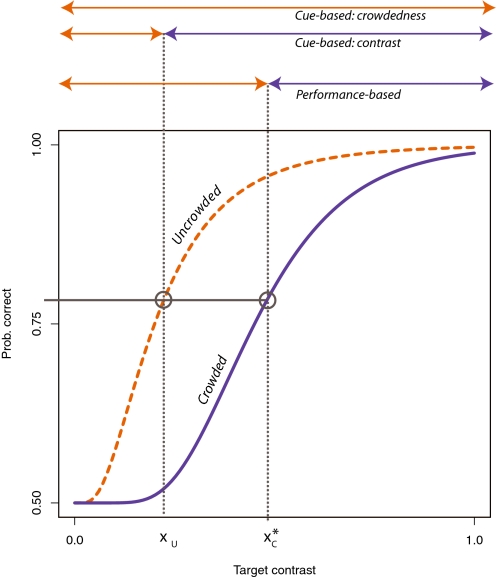
 . Alternatively, if confidence follows performance, what the observer should do is choose the crowded stimulus as soon as it yields a higher expected performance: here, any point beyond
  . As shown above the plot, for any
  , the predictions of the performance-based hypothesis differ from those of either of the two cue-based models.
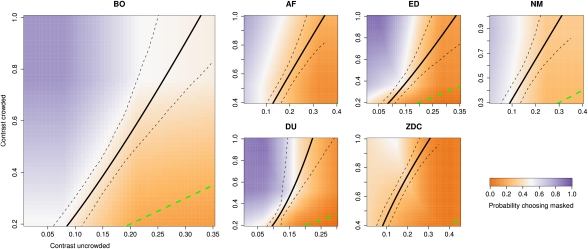
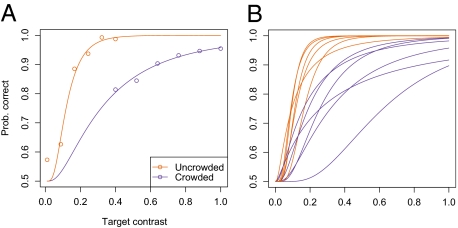
 means that the observer had equal probability of making a correct orientation judgment by picking either stimulus. The expected performance ratio is computed from the results of an independent baseline condition (Fig. 2) and shown along with 10–90% bootstrap quantiles (dashed lines) (
 : Note that the contrast levels for crowded stimuli were on average higher, because the case
  is relatively uninteresting in the context of this experiment (all theories predict that the observer should choose the uncrowded stimulus). NM performed under different feedback conditions than the other five observers (Materials and Methods).
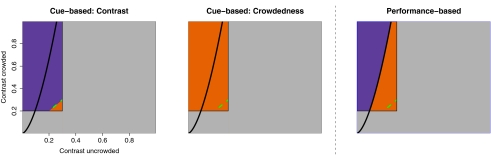
References
-
- Henmon VAC. The relation of the time of a judgment to its accuracy. Psychol Rev. 1911;18:186–201.
-
- Smith JD, Shields WE, Washburn DA. The comparative psychology of uncertainty monitoring and metacognition. Behav Brain Sci. 2003;26:317–339. discussion 340–373. - PubMed
-
- Grinband J, Hirsch J, Ferrera VP. A neural representation of categorization uncertainty in the human brain. Neuron. 2006;49:757–763. - PubMed
-
- Kepecs A, Uchida N, Zariwala HA, Mainen ZF. Neural correlates, computation and behavioural impact of decision confidence. Nature. 2008;455:227–231. - PubMed
Publication types
MeSH terms
LinkOut - more resources
Full Text Sources
