

Review
doi: 10.1093/carcin/bgq239.
Epub 2010 Nov 12.
Mutation and epigenetic molecular clocks in cancer
Affiliations
- PMID: 21076057
- PMCID: PMC3026845
- DOI: 10.1093/carcin/bgq239
Item in Clipboard
Review
Mutation and epigenetic molecular clocks in cancer
Carcinogenesis.
2011 Feb.
Abstract
A quandary of evolution is how to measure change over time. A natural inclination is to use morphologic criteria-the greater the differences between two phenotypes, the greater amount of time needed to evolve these differences. However, appearances may be deceiving, and another approach to infer time is with molecular clocks. Here, the greater the differences between two genomes, on average the greater the time since a common ancestor. Recent advances in DNA sequencing shed new light on how human cancers might evolve.
Figures

Calculating PWD. (A) PWDs count differences between homologous 5′ to 3′ sites (circles) and can be calculated between allele pairs or groups of alleles (average PWD). (B) Examples of the 5′ to 3′ methylation patterns of eight epialleles sampled from CRC glands from left and right sides of the same tumor (filled circles are methylated CpG sites). Average PWDs measure diversity within and between glands. The glands of Cancer 12 are more diverse than the glands of Cancer 2 (also see Figure 5).

Cancer evolution. (A) A progression ladder illustrates stepwise changes in phenotypes, thought to be caused by the selection of new driver mutations (arrows). A ladder implies common ‘starts’, intermediate stages and ‘finishes’ and therefore, it should be possible to organize the data from many cancers into a single ladder. However, data from multiple cancers are difficult to incorporate into ladders because starting germ line genomes are very different, most mutations are passenger mutations, and common driver mutations have been difficult to identify. (B) Genealogies follow genomes and not phenotypes. A somatic cell genealogy starts at the zygote and ends at present day genomes, which are almost exact copies of prior copies. Replication errors (primarily passengers) accumulate throughout life, and these errors may record the past. The multiple genomes in a tumor eventually trace back to a common ancestor called the first transformed cell. Clonal cancer mutations accumulate in the interval between the zygote and the first transformed cell. Variant mutations accumulate after transformation. Intervals before or after transformation can be reconstructed by counting the numbers of clonal or variant mutations. The total numbers of clonal somatic mutations in cancer genomes are few enough to be consistent with the numbers of mutations that may accumulate solely due to normal replication errors. Because visible tumors appear later in life, most ‘cancer’ mutations first accumulate in normal appearing tissues.
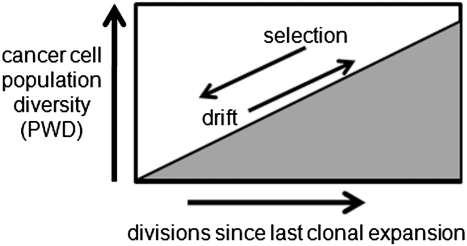
Inferring selection. PWDs can infer selection because PWDs are low after selection and clonal expansion, but then progressively increase from the accumulation of random replication errors. A diverse population is an older population, which implies inefficient selection because the last sweep occurred long ago.
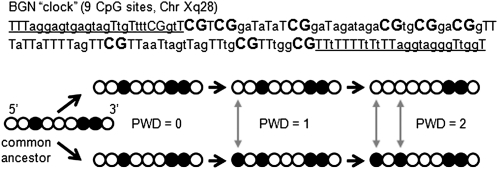
Epigenetic molecular clocks. The 5′ to 3′ order of methylation can be used to calculate PWDs (filled circles are methylated CpG sites). Epigenetic molecular clocks are more suitable for somatic cell evolution reconstruction because patterns are copied almost exactly between generations, but replication error rates are relatively high. Variant methylation patterns can be read after bisulfite sequencing of cloned polymerase chain reaction products. Illustrated is the BGN clock with nine CpG sites after bisulfite treatment (primer sites are underlined, CpG sites in bold).

Cancer evolution after transformation. (A) Stepwise cancer evolution (Figure 2A) can be ‘reconstructed’ by simple visual inspection, assuming changes in phenotype are caused by the sequential selection of new mutations. It is also possible that the cancer represents a single clonal expansion. The diversity of CRC glands sampled from different parts of the same cancer differs between these models. Glands are small neighboring populations of about 2000–10 000 cells that can be isolated from fresh CRCs by an ethylenediaminetetraacetic acid-washout method. There will be a gradient of diversity with stepwise progression (oldest regions with more diverse glands), whereas all glands of a single clonal expansion will have similar diversities and ages. (B) Data from two human CRCs (24) illustrate that PWDs of individual cancer glands (circles) are low in Cancer 2 and higher in Cancer 12. Consistent with single clonal expansions, glands from the left and right sides of the same cancer have similar PWDs or mitotic ages. Gland data from these cancers are also presented in Figure 1B. (C) The mitotic age of a cancer may be estimated by measuring PWDs between epialleles sampled from the least related cells or cells from opposite cancer sides. The data illustrate that PWDs between glands are similar to PWDs within glands, consistent with a single clonal expansion and infrequent selection and clonal evolution after transformation. (D) Epialleles sampled from laser capture microscopy isolated glands (circles on microscopic section) allow comparisons between physical and PWD. Consistent with a single clonal expansion and a star phylogeny, there was no significant increase in PWD with physical distance, with adjacent glands as related as more distant glands.
References
-
- Bromham L, et al. The modern molecular clock. Nat. Rev. Genet. 2003;4:216–224. - PubMed
-
- Chimpanzee Sequencing and Analysis Consortium. Initial sequence of the chimpanzee genome and comparison with the human genome. Nature. 2005;437:69–87. - PubMed
-
- Tishkoff SA, et al. Implications of biogeography of human populations for ‘race’ and medicine. Nat. Genet. 2004;36:S21–S27. - PubMed
-
- Wood LD, et al. The genomic landscapes of human breast and colorectal cancers. Science. 2007;318:1108–1113. - PubMed
Publication types
MeSH terms
Grants and funding
LinkOut - more resources
Full Text Sources
Other Literature Sources
