

Accuracy of out-of-field dose calculations by a commercial treatment planning system
- PMID: 21076191
- PMCID: PMC3152254
- DOI: 10.1088/0031-9155/55/23/S03
Accuracy of out-of-field dose calculations by a commercial treatment planning system
Abstract
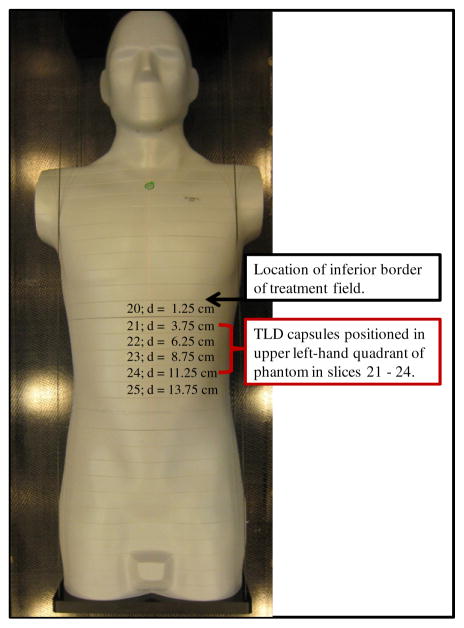
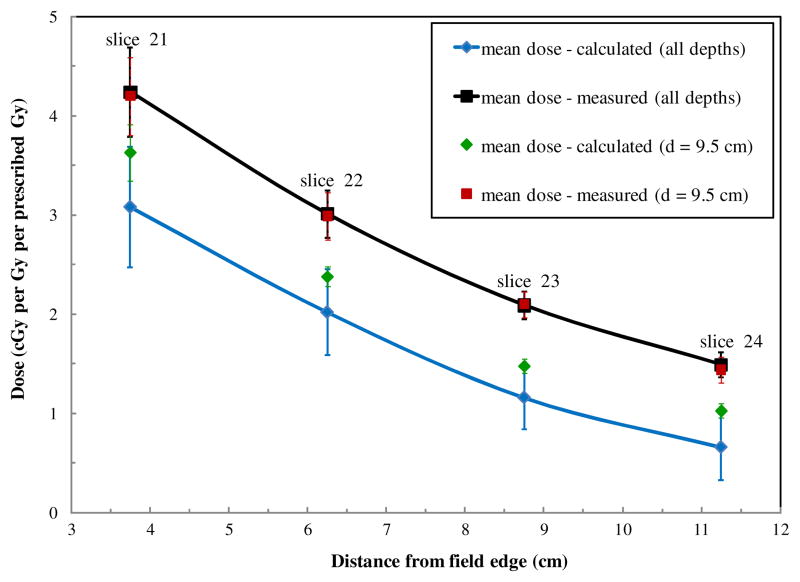
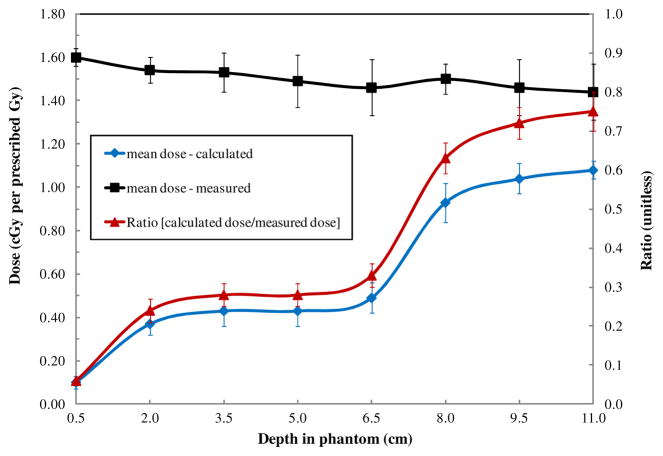
The dosimetric accuracy of treatment planning systems (TPSs) decreases for locations outside the treatment field borders. However, the true accuracy of specific TPSs for locations beyond the treatment field borders is not well documented. Our objective was to quantify the accuracy of out-of-field dose predicted by the commercially available Eclipse version 8.6 TPS (Varian Medical Systems, Palo Alto, CA) for a clinical treatment delivered on a Varian Clinac 2100. We calculated (in the TPS) and determined (with thermoluminescent dosimeters) doses at a total of 238 points of measurement (with distance from the field edge ranging from 3.75 to 11.25 cm). Our comparisons determined that the Eclipse TPS underestimated out-of-field doses by an average of 40% over the range of distances examined. As the distance from the treatment field increased, the TPS underestimated the dose with increasing magnitude--up to 55% at 11.25 cm from the treatment field border. These data confirm that accuracy beyond the treatment border is inadequate, and out-of-field data from TPSs should be used only with a clear understanding of this limitation. Studies that require accurate out-of-field dose should use other dose reconstruction methods, such as direct measurements or Monte Carlo calculations.
Figures
Similar articles
-
Accuracy and sources of error of out-of field dose calculations by a commercial treatment planning system for intensity-modulated radiation therapy treatments.J Appl Clin Med Phys. 2013 Mar 4;14(2):4139. doi: 10.1120/jacmp.v14i2.4139. J Appl Clin Med Phys. 2013. PMID: 23470942 Free PMC article.
-
Study of out-of-field dose in photon radiotherapy: A commercial treatment planning system versus measurements and Monte Carlo simulations.Med Phys. 2020 Sep;47(9):4616-4625. doi: 10.1002/mp.14356. Epub 2020 Jul 16. Med Phys. 2020. PMID: 32583441 Free PMC article.
-
Assessment of accuracy of out-of-field dose calculations by TiGRT treatment planning system in radiotherapy.J Cancer Res Ther. 2018 Apr-Jun;14(3):634-639. doi: 10.4103/0973-1482.176423. J Cancer Res Ther. 2018. PMID: 29893331
-
Accuracy of out-of-field dose calculation of tomotherapy and cyberknife treatment planning systems: a dosimetric study.Z Med Phys. 2014 Sep;24(3):211-5. doi: 10.1016/j.zemedi.2013.10.008. Epub 2013 Nov 28. Z Med Phys. 2014. PMID: 24290992
-
High-density dental implants and radiotherapy planning: evaluation of effects on dose distribution using pencil beam convolution algorithm and Monte Carlo method.J Appl Clin Med Phys. 2015 Sep 8;16(5):46–52. doi: 10.1120/jacmp.v16i5.5612. J Appl Clin Med Phys. 2015. PMID: 26699323 Free PMC article. Review.
Cited by
-
Revisiting fetal dose during radiation therapy: evaluating treatment techniques and a custom shield.J Appl Clin Med Phys. 2016 Sep 8;17(5):34-46. doi: 10.1120/jacmp.v17i5.6135. J Appl Clin Med Phys. 2016. PMID: 27685109 Free PMC article.
-
The predicted relative risk of premature ovarian failure for three radiotherapy modalities in a girl receiving craniospinal irradiation.Phys Med Biol. 2013 May 21;58(10):3107-23. doi: 10.1088/0031-9155/58/10/3107. Epub 2013 Apr 19. Phys Med Biol. 2013. PMID: 23603657 Free PMC article.
-
A comparative study on the risks of radiogenic second cancers and cardiac mortality in a set of pediatric medulloblastoma patients treated with photon or proton craniospinal irradiation.Radiother Oncol. 2014 Oct;113(1):84-8. doi: 10.1016/j.radonc.2014.07.003. Epub 2014 Aug 12. Radiother Oncol. 2014. PMID: 25128084 Free PMC article.
-
Cherenkov imaging combined with scintillation dosimetry provides real-time positional and dose monitoring for radiotherapy patients with cardiac implanted electronic devices.Phys Imaging Radiat Oncol. 2024 Sep 12;32:100642. doi: 10.1016/j.phro.2024.100642. eCollection 2024 Oct. Phys Imaging Radiat Oncol. 2024. PMID: 39315342 Free PMC article.
-
Comparison of the accuracy of Monte Carlo and Ray Tracing dose calculation algorithms for multiple target brain treatments on CyberKnife.Phys Eng Sci Med. 2023 Dec;46(4):1477-1487. doi: 10.1007/s13246-023-01312-w. Epub 2023 Aug 8. Phys Eng Sci Med. 2023. PMID: 37552365
References
-
- Almond PR, Biggs PJ, Coursey BM, Hanson WF, Huq MS, Nath R, Rogers DWO. AAPM’s TG-51 protocol for clinical reference dosimetry of high-energy photon and electron beams. Med Phys. 1999;26:1847–70. - PubMed
-
- Aspradakis MM, Morrison RH, Richmond ND, Steele A. Experimental verification of convolution/superposition photon dose calculations for radiotherapy treatment planning. Phys Med Biol. 2003;48:2873–93. - PubMed
-
- Das IJ, Cheng CW, Watts RJ, Ahnesjo A, Gibbons J, Li XA, Lowenstein J, Mitra RK, Simon WE, Zhu TC. Accelerator beam data commissioning equipment and procedures: report of the TG-106 of the therapy physics committee of the AAPM. Med Phys. 2008;35:4186–215. - PubMed
-
- Fogliata A, Nicolini G, Vanetti E, Clivio A, Cozzi L. Dosimetric validation of the anisotropic analytical algorithm for photon dose calculation: fundamental characterization in water. Phys Med Biol. 2006;51:1421–38. - PubMed
Publication types
MeSH terms
Grants and funding
LinkOut - more resources
Full Text Sources
Other Literature Sources
Research Materials