

Effect of organ size and position on out-of-field dose distributions during radiation therapy
- PMID: 21076195
- PMCID: PMC3152250
- DOI: 10.1088/0031-9155/55/23/S05
Effect of organ size and position on out-of-field dose distributions during radiation therapy
Abstract
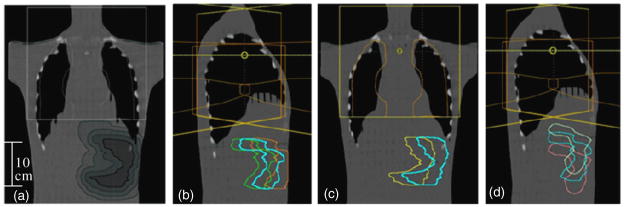
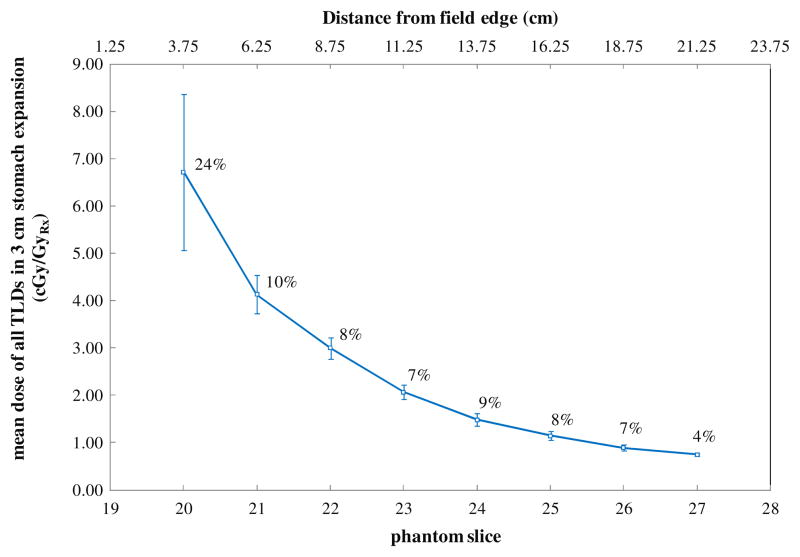
Mantle field irradiation has historically been the standard radiation treatment for Hodgkin lymphoma. It involves treating large regions of the chest and neck with high doses of radiation (up to 30 Gy). Previous epidemiological studies on the incidence of second malignancies following radiation therapy for Hodgkin lymphoma have revealed an increased incidence of second tumors in various organs, including lung, breast, thyroid and digestive tract. Multiple other studies, including the Surveillance, Epidemiology and End Results, indicated an increased incidence in digestive tract including stomach cancers following mantle field radiotherapy. Assessment of stomach dose is challenging because the stomach is outside the treatment field but very near the treatment border where there are steep dose gradients. In addition, the stomach can vary greatly in size and position. We sought to evaluate the dosimetric impact of the size and variable position of the stomach relative to the field border for a typical Hodgkin lymphoma mantle field irradiation. The mean stomach dose was measured using thermoluminescent dosimetry for nine variations in stomach size and position. The mean doses to the nine stomach variations ranged from 0.43 to 0.83 Gy when 30 Gy was delivered to the treatment isocenter. Statistical analyses indicated that there were no significant differences in the mean stomach dose when the stomach was symmetrically expanded up to 3 cm or shifted laterally (medial, anterior or posterior shifts) by up to 3 cm. There was, however, a significant (P > 0.01) difference in the mean dose when the stomach was shifted superiorly or inferiorly by ≥2.5 cm.
Figures
Similar articles
-
Prediction of the location and size of the stomach using patient characteristics for retrospective radiation dose estimation following radiotherapy.Phys Med Biol. 2013 Dec 21;58(24):8739-53. doi: 10.1088/0031-9155/58/24/8739. Epub 2013 Dec 4. Phys Med Biol. 2013. PMID: 24301086 Free PMC article.
-
Radiotherapy for early mediastinal Hodgkin lymphoma according to the German Hodgkin Study Group (GHSG): the roles of intensity-modulated radiotherapy and involved-node radiotherapy.Int J Radiat Oncol Biol Phys. 2012 May 1;83(1):268-76. doi: 10.1016/j.ijrobp.2011.05.054. Epub 2011 Nov 11. Int J Radiat Oncol Biol Phys. 2012. PMID: 22079733
-
Individualized 3D reconstruction of normal tissue dose for patients with long-term follow-up: a step toward understanding dose risk for late toxicity.Int J Radiat Oncol Biol Phys. 2012 Nov 15;84(4):e557-63. doi: 10.1016/j.ijrobp.2012.06.026. Epub 2012 Aug 25. Int J Radiat Oncol Biol Phys. 2012. PMID: 22929861
-
[Radiotherapy in adults with localized supradiaphragmatic stages CS I/II of Hodgkin's disease. 2. The special aspects of radiotherapy: dosage, fractionation, focal volumes, risks, conclusions].Strahlenther Onkol. 1993 Oct;169(10):570-83. Strahlenther Onkol. 1993. PMID: 8235981 Review. German.
-
Estimated Doses to the Heart, Lungs and Oesophagus and Risks From Typical UK Radiotherapy for Early Breast Cancer During 2015-2023.Clin Oncol (R Coll Radiol). 2024 Sep;36(9):e322-e332. doi: 10.1016/j.clon.2024.05.002. Epub 2024 May 6. Clin Oncol (R Coll Radiol). 2024. PMID: 38853062 Free PMC article.
Cited by
-
Accuracy of out-of-field dose calculations by a commercial treatment planning system.Phys Med Biol. 2010 Dec 7;55(23):6999-7008. doi: 10.1088/0031-9155/55/23/S03. Epub 2010 Nov 12. Phys Med Biol. 2010. PMID: 21076191 Free PMC article.
-
Prediction of the location and size of the stomach using patient characteristics for retrospective radiation dose estimation following radiotherapy.Phys Med Biol. 2013 Dec 21;58(24):8739-53. doi: 10.1088/0031-9155/58/24/8739. Epub 2013 Dec 4. Phys Med Biol. 2013. PMID: 24301086 Free PMC article.
-
Analytical model for out-of-field dose in photon craniospinal irradiation.Phys Med Biol. 2013 Nov 7;58(21):7463-79. doi: 10.1088/0031-9155/58/21/7463. Epub 2013 Oct 8. Phys Med Biol. 2013. PMID: 24099782 Free PMC article.
References
-
- Bassal M, et al. Risk of selected subsequent carcinomas in survivors of childhood cancer: a report from the childhood cancer survivor study. J Clin Oncol. 2006;24:476–83. - PubMed
-
- Bentel GC. Radiation Therapy Planning. 2. New York: McGraw-Hill; 1996.
-
- Boivin J-F, et al. Incidence of second cancers in patients treated for Hodgkin’s disease. J Natl Cancer Inst. 1995;87:732–41. - PubMed
-
- Bontrager KL. Textbook of Radiographic Positioning and Related Anatomy. St Louis, MO: Mosby; 1997.
-
- Csendes A, Burgos A. Size, volume and weight of the stomach in patients with morbid obesity compared to controls. Obes Surg. 2005;15:1133–6. - PubMed
Publication types
MeSH terms
Grants and funding
LinkOut - more resources
Full Text Sources
Medical