. 2010 Dec;42(12):1086-92.
doi: 10.1038/ng.713. Epub 2010 Nov 14.

Overexpression of Fto leads to increased food intake and results in obesity

Affiliations

Overexpression of Fto leads to increased food intake and results in obesity

Chris Church et al. Nat Genet. 2010 Dec.

Abstract

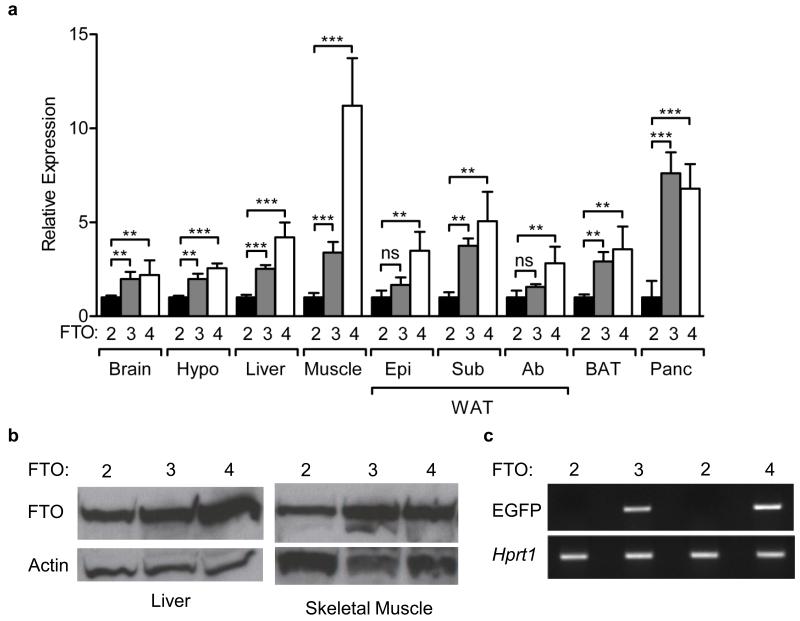
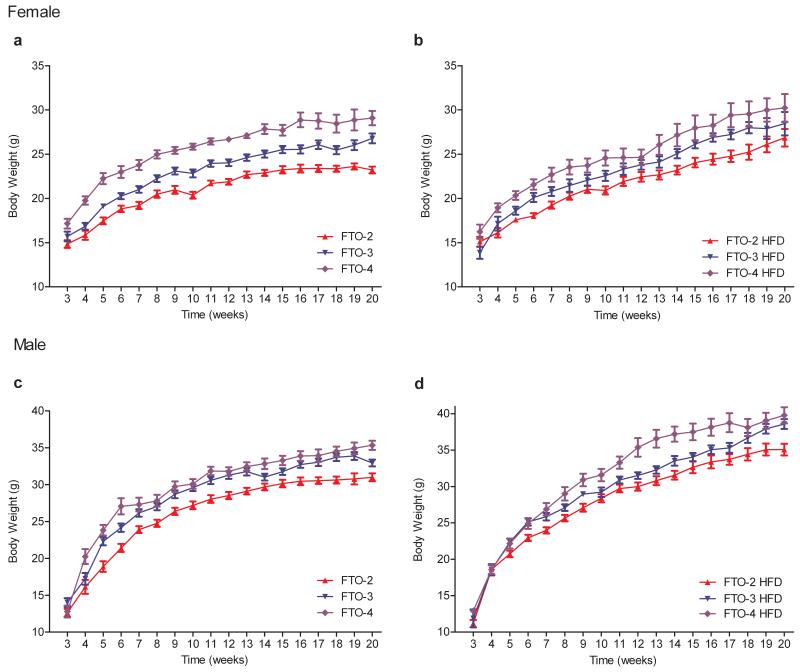
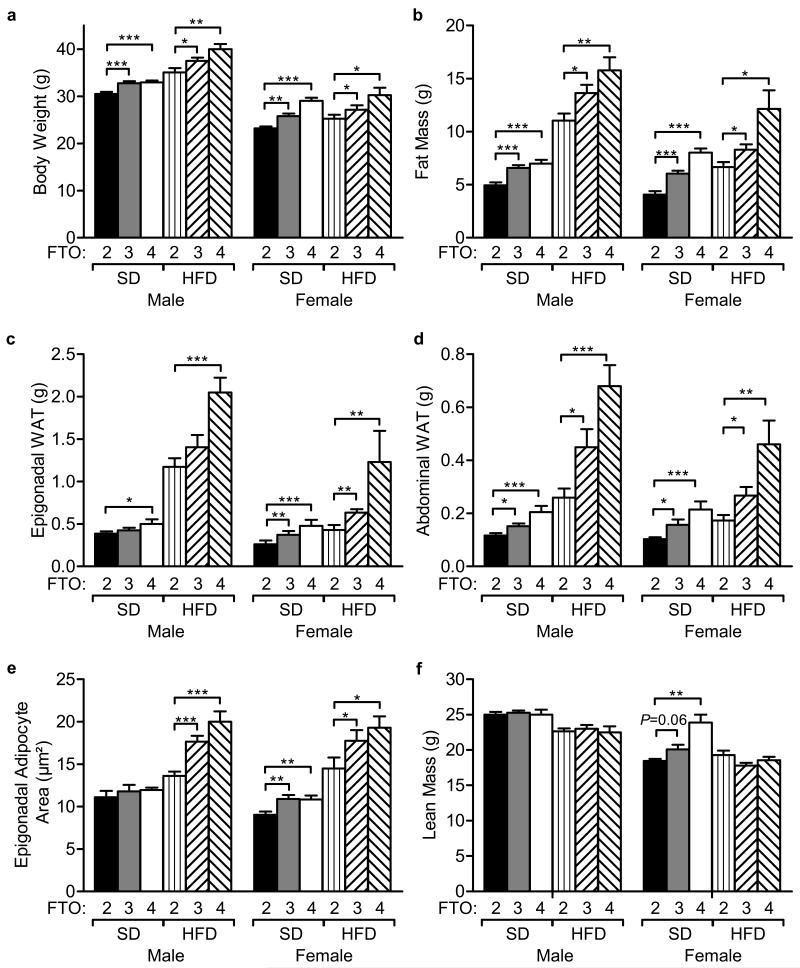
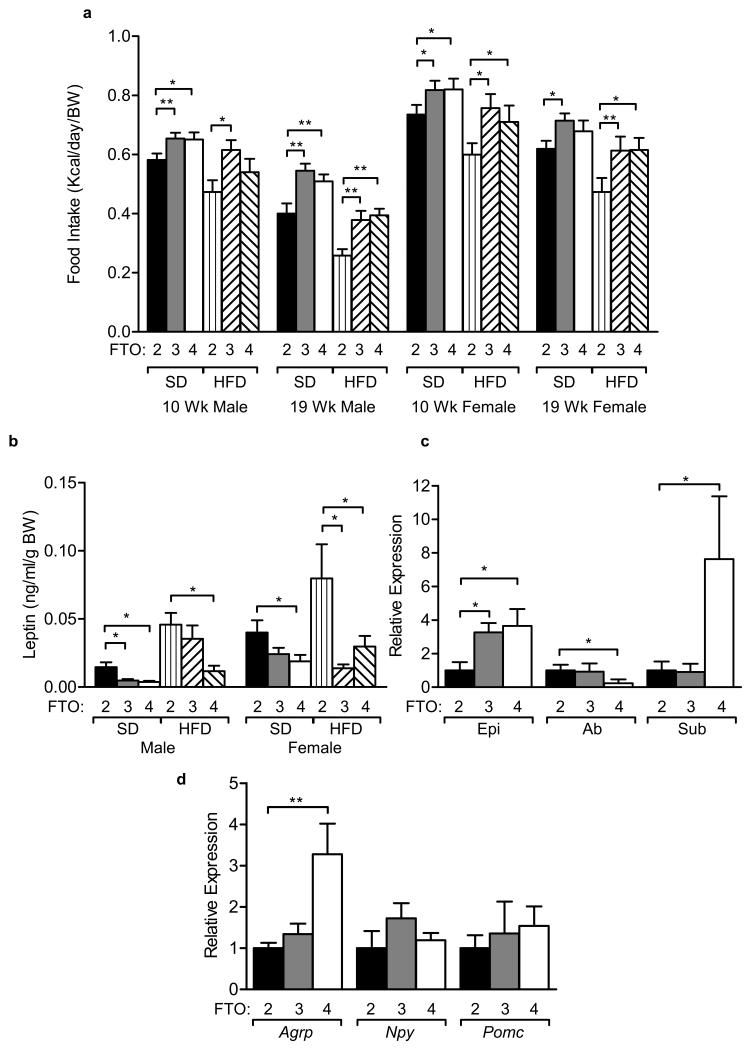
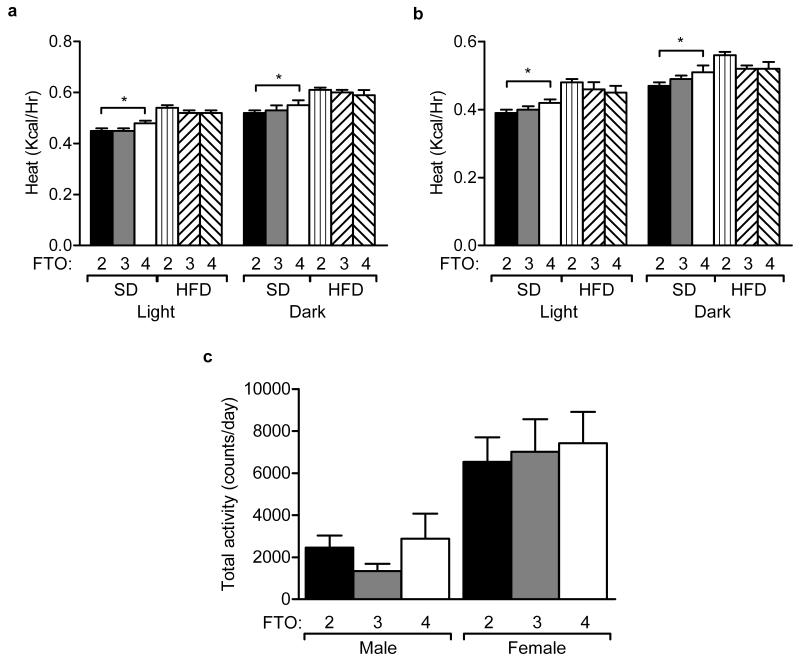
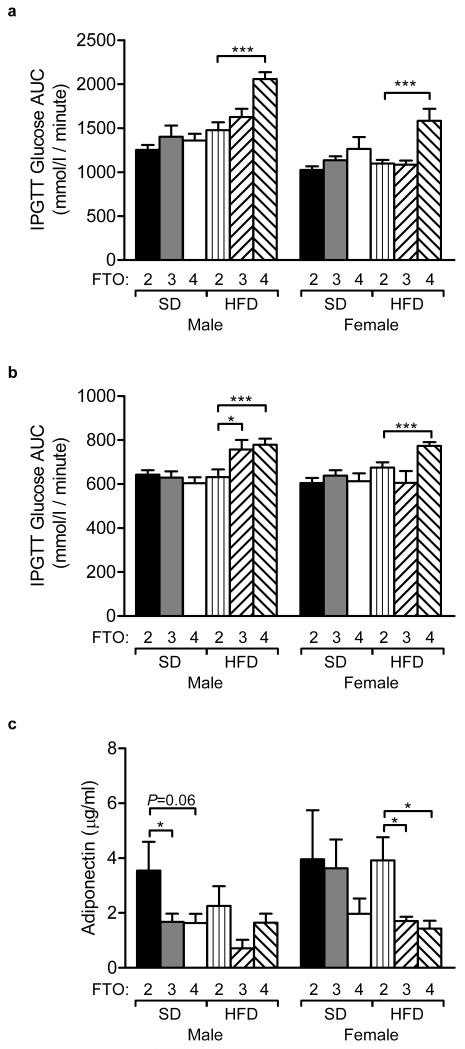
Genome-wide association studies have identified SNPs within FTO, the human fat mass and obesity-associated gene, that are strongly associated with obesity. Individuals homozygous for the at-risk rs9939609 A allele weigh, on average, ~3 kg more than individuals with the low-risk T allele. Mice that lack FTO function and/or Fto expression display increased energy expenditure and a lean phenotype. We show here that ubiquitous overexpression of Fto leads to a dose-dependent increase in body and fat mass, irrespective of whether mice are fed a standard or a high-fat diet. Our results suggest that increased body mass results primarily from increased food intake. Mice with increased Fto expression on a high-fat diet develop glucose intolerance. This study provides the first direct evidence that increased Fto expression causes obesity in mice.


Figures

Figure 1
Figure 1. Generation of a mouse model overexpressing Fto
(a) Relative Fto expression in the indicated tissues of FTO-2 (n=10) FTO-3 (n=10) and FTO-4 (n=10) mice. Epi, epigonadal. Ab, abdominal. Sub, subcutaneous. WAT, white adipose tissue. Data are expressed as mean±standard error (s.e.m.). *P<0.05, **P<0.01, ***P<0.0001. ns, non-significant. (b) Representative Western blots of FTO and actin (loading control) from skeletal muscle and liver from FTO-2, FTO-3 and FTO-4 mice. (c) RT-PCR of EGFP using brain cDNA prepared from FTO-2, FTO-3 and FTO-4 mice. Hypoxanthine-guanine phosphoribosyltransferase (Hprt1) is included as a control.
Figure 2
Figure 2. Fto dose-dependent increases in body weight are observed in male and female mice on standard (SD) and high fat (HFD) diets
(a) Females SD, FTO-2 (wild-type, n=16), FTO-3 (n=28, P=0.0003) and FTO-4 (n=16, P<0.0001) (b) Females HFD, FTO-2 (n=15), FTO-3 (n=14, P=0.04) and FTO-4 (n=15, P=0.002) (c) Males SD, FTO-2 (n=16), FTO-3 (n=31, P=0.001) and FTO-4 (n=16, P=0.0001). (d) Males HFD, FTO-2 (n=18), FTO-3 (n=15, P=0.01) and FTO-4 (n=16, P<0.0001). Data are expressed as mean±s.e.m. Statistical analysis was performed using a repeated measures ANOVA. All P values are against FTO-2.
Figure 3
Figure 3. Body Composition varies with Fto copy number
(a) Body weight of 20-week old male and female mice on a standard (SD) and high fat diet (HFD). Males: SD, FTO-2 (n=16), FTO-3 (n=31), FTO-4 (n=15); HFD, FTO-2 (n=18), FTO-3 (n=15), FTO-4 (n=16). Females: SD, FTO-2 (n=16), FTO-3 (n=28), FTO-4 (n=16); HFD, FTO-2 (n=15), FTO-3 (n=14), FTO-4 (n=15). (b) Total fat mass measured by DEXA scanning in male and female mice on standard (SD) and high fat diets (HFD). Males: SD, FTO-2 (n=16), FTO-3 (n=30), FTO-4 (n=15); HFD, FTO-2 (n=17), FTO-3 (n=15), FTO-4 (n=16). Females: SD, FTO-2 (n=16), FTO-3 (n=28), FTO-4 (n=16); HFD, FTO-2 (n=16), FTO-3 (n=14), FTO-4 (n=15). (c,d) Weights of epigonadal WAT (c) and abdominal WAT (d) in mice overexpressing Fto. Males: SD, FTO-2 (n=16), FTO-3 (n=21), FTO-4 (n=15); HFD, FTO-2 (n=15), FTO-3 (n=14), FTO-4 (n=14). Females: SD, FTO-2 (n=15), FTO-3 (n=28), FTO-4 (n=15); HFD, FTO-2 (n=12), FTO-3 (n=14), FTO-4 (n=14). (e) Epigonadal adipocyte area is increased in female mice on both standard and high fat diets and in males on a HFD (n=5 in each case). (f) Lean body mass in male and female mice on SD and HFD. Same mouse numbers as in (b). Data (a-f) are expressed as mean±s.e.m. *P<0.05, **P<0.01, ***P<0.0001.
Figure 4
Figure 4. Effects of FTO on energy intake and plasma leptin
(a) Food intake over 24 hours normalised to body weight (BW), measured in 10 and 19-week old mice. Males: SD, FTO-2 (n=16) FTO-3 (n=31) and FTO-4 (n=16); HFD, FTO-2 (n=18) FTO-3 (n=15) and FTO-4 (n=16). Females: SD, FTO-2 (n=16), FTO-3 (n=28) and FTO-4 (n=16); HFD, FTO-2 (n=15) FTO-3 (n=14) and FTO-4 (n=15). (b) Plasma leptin levels at 8 weeks of age adjusted for body weight (BW) following an overnight 16-hour fast. Males: SD, FTO-2 (n=14), FTO-3 (n=25), FTO-4 (n=14); HFD, FTO-2 (n=12), FTO-3 (n=12), FTO-4 (n=12). Females: SD, FTO-2 (n=16), FTO-3 (n=25), FTO-4 (n=14); HFD, FTO-2 (n=13), FTO-3 (n=10), FTO-4 (n=10). (c) Relative Leptin (Lep) gene expression in 20 week-old female epigonadal (Epi), abdominal (Ab) and subcutaneous (sub) WAT. FTO-2 (n=10), FTO-3 (n=10), FTO-4 (n=10). (d) Relative gene expression of hypothalamic neuropeptides. FTO-2 (n=10) FTO-3 (n=10) and FTO-4 (n=10) mice. Data (a-d) are expressed as mean±s.e.m. *P<0.05, **P<0.01, ***P<0.0001.
Figure 5
Figure 5. Effects of Fto on energy expenditure and physical activity
(a) Male and (b) Female heat production over a 22-hour period during the light and dark phases for 18-week old male (a,b) and female (c,d) mice on a standard (SD) or high fat diet (HFD). Males: SD, FTO-2 (n=15), FTO-3 (n=25), FTO-4 (n=16); HFD, FTO-2 (n=12), FTO-3 (n=12), FTO-4 (n=15). Females: SD, FTO-2 (n=16), FTO-3 (n=22), FTO-4 (n=15); HFD, FTO-2 (n=12), FTO-3 (n=13), FTO-4 (n=14). (c) Physical activity measured as the number of rotations of an activity wheel in a 7-day period, following a 3-day entrainment period. Males and females: FTO-2 (n=7), FTO-3 (n=7), FTO-4 (n=6). Data (a-c) are expressed as mean±s.e.m. *P<0.05, **P<0.01
Figure 6
Figure 6. Glucose homeostasis and Fto overexpression
(a) Area under the curve (AUC) during a 120-minute IPGTT in 12-week old mice. Males: SD, FTO-2 (n=15), FTO-3 (n=25), FTO-4 (n=16); HFD, FTO-2 (n=12), FTO-3 (n=13), FTO-4 (n=12). Females: SD, FTO-2 (n=16), FTO-3 (n=22), FTO-4 (n=15); HFD, FTO-2 (n=12), FTO-3 (n=12), FTO-4 (n=13). (b) AUC analysis for glucose during a 30-minute IPGTT in 16-week old mice. Males: SD, FTO-2 (n=15), FTO-3 (n=23), FTO-4 (n=15); HFD, FTO-2 (n=12), FTO-3 (n=12), FTO-4 (n=14). Females: SD, FTO-2 (n=16), FTO-3 (n=22), FTO-4 (n=15); HFD, FTO-2 (n=12), FTO-3 (n=11), FTO-4 (n=15). (c) Adiponectin levels at 20-weeks of age following a 6-hour light phase fast. Males: SD, FTO-2 (n=12), FTO-3 (n=22), FTO-4 (n=10); HFD, FTO-2 (n=12), FTO-3 (n=10), FTO-4 (n=10). Females: SD, FTO-2 (n=11), FTO-3 (n=22), FTO-4 (n=9); HFD, FTO-2 (n=10), FTO-3 (n=9), FTO-4 (n=10). Data (a-c) are expressed as mean±s.e.m. *P<0.05, **P<0.01, ***P<0.0001.

Comment in

  • FTO gains function.
    Stratigopoulos G, Leibel RL. Stratigopoulos G, et al. Nat Genet. 2010 Dec;42(12):1038-9. doi: 10.1038/ng1210-1038. Nat Genet. 2010. PMID: 21102620 Free PMC article.
  • FTO and obesity: the missing link.
    Farooqi IS. Farooqi IS. Cell Metab. 2011 Jan 5;13(1):7-8. doi: 10.1016/j.cmet.2010.12.016. Cell Metab. 2011. PMID: 21195343

References

    1. Kelly T, Yang W, Chen CS, Reynolds K, He J. Global burden of obesity in 2005 and projections to 2030. Int J Obes (Lond) 2008;32:1431–7. - PubMed
    1. Scuteri A, et al. Genome-wide association scan shows genetic variants in the FTO gene are associated with obesity-related traits. PLoS Genet. 2007;3:e115. - PMC - PubMed
    1. Hinney A, et al. Genome wide association (GWA) study for early onset extreme obesity supports the role of fat mass and obesity associated gene (FTO) variants. PLoS One. 2007;2:e1361. - PMC - PubMed
    1. Frayling TM, et al. A common variant in the FTO gene is associated with body mass index and predisposes to childhood and adult obesity. Science. 2007;316:889–94. - PMC - PubMed
    1. Dina C, et al. Variation in FTO contributes to childhood obesity and severe adult obesity. Nat Genet. 2007;39:724–6. - PubMed

Publication types

MeSH terms